
LINKUSDT "Channel" Breakout Analysis
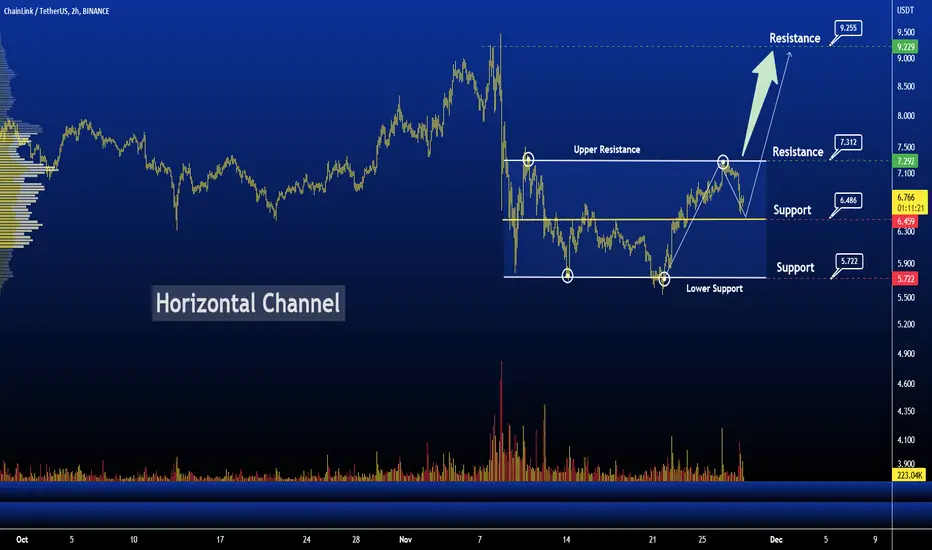
The above chart of Bitcoin laid out the Horizontal channel pattern. Horizontal channel pattern also known as the sideways trend. In general, the horizontal channel is formed during the price consolidation. In this pattern, the upper trendline, the line which connects the highs, and the lower trendline, line which connects the lows, run horizontally parallel and the price action is contained within it. A horizontal channel is often regarded as one of the suitable patterns for timing the market as the buying and selling points are in consolidation.
Currently, LINKUSDT is in the range of $6.764. If the pattern continues, the price of LINKUSDT might reach the resistance levels of $9.255 If the trend reverses, then the price of LINKUSDT may fall to $5.722
Happy Trading
The above chart of Bitcoin laid out the Horizontal channel pattern. Horizontal channel pattern also known as the sideways trend. In general, the horizontal channel is formed during the price consolidation. In this pattern, the upper trendline, the line which connects the highs, and the lower trendline, line which connects the lows, run horizontally parallel and the price action is contained within it. A horizontal channel is often regarded as one of the suitable patterns for timing the market as the buying and selling points are in consolidation.
Currently, LINKUSDT is in the range of $6.764. If the pattern continues, the price of LINKUSDT might reach the resistance levels of $9.255 If the trend reverses, then the price of LINKUSDT may fall to $5.722
Happy Trading
Giao dịch đang hoạt động
Giao dịch đang hoạt động
Giao dịch đang hoạt động
Giao dịch đang hoạt động
Giao dịch đang hoạt động

Bài đăng liên quan
Thông báo miễn trừ trách nhiệm
Thông tin và các ấn phẩm này không nhằm mục đích, và không cấu thành, lời khuyên hoặc khuyến nghị về tài chính, đầu tư, giao dịch hay các loại khác do TradingView cung cấp hoặc xác nhận. Đọc thêm tại Điều khoản Sử dụng.
Bài đăng liên quan
Thông báo miễn trừ trách nhiệm
Thông tin và các ấn phẩm này không nhằm mục đích, và không cấu thành, lời khuyên hoặc khuyến nghị về tài chính, đầu tư, giao dịch hay các loại khác do TradingView cung cấp hoặc xác nhận. Đọc thêm tại Điều khoản Sử dụng.