
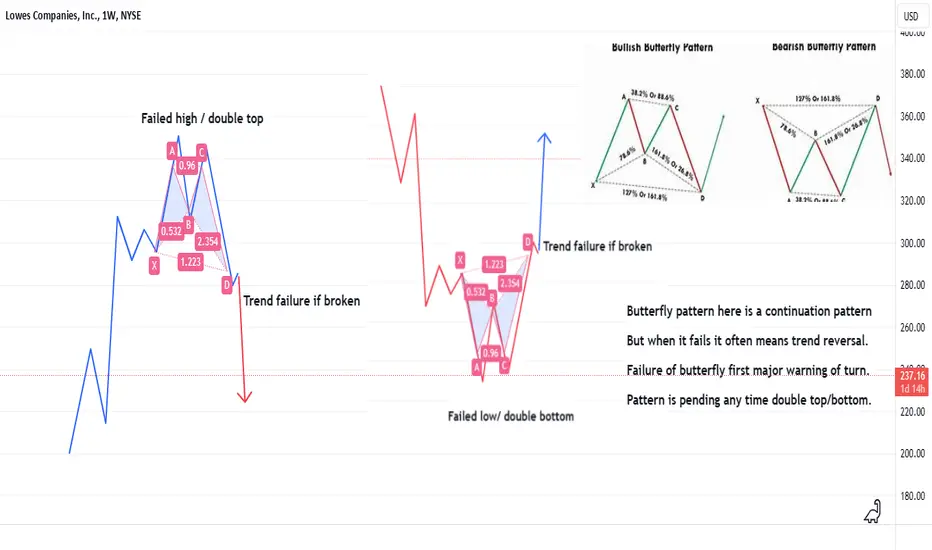
This strategy is intended to be a method to help to differentiate a pullback from reversal.
Here we're using the butterfly pattern which is a continuation pattern, but the failure of this continuation pattern can mean the failure of the trend.
It's a very useful signal that can be used on all time frames. You can find great examples of this before crashes (Such as 2007 - 2008) and also near the lows of major downtrends.
The strategy also works great for day trading. Spotting the breaking of intraday trends.
Usually upon the breaking of this pattern the momentum picks up.
Meaning a bearish break leads to capitulation and bullish break leads to parabolic move.
Very useful for spotting reversals and a method for trailing stop losses.
----
This is a counter strategy to the butterfly continuation.
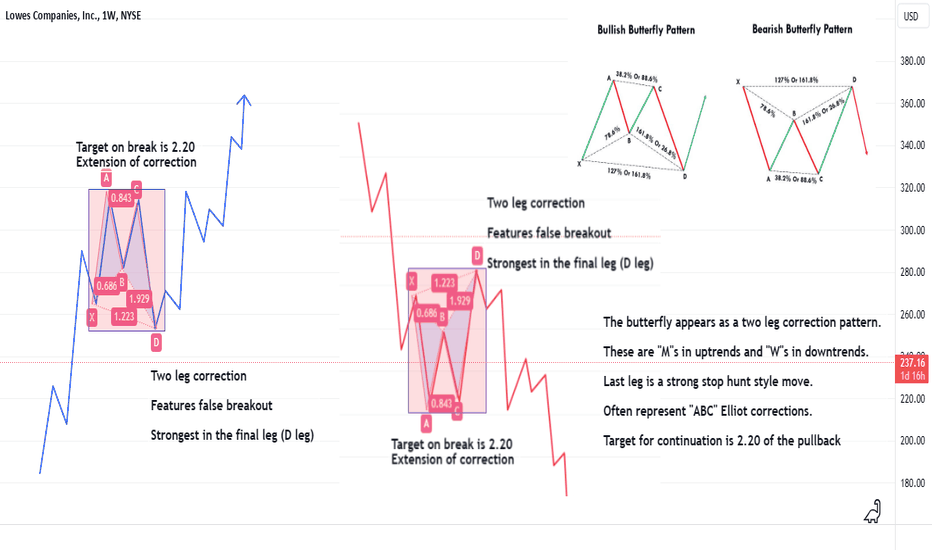
Here we're using the butterfly pattern which is a continuation pattern, but the failure of this continuation pattern can mean the failure of the trend.
It's a very useful signal that can be used on all time frames. You can find great examples of this before crashes (Such as 2007 - 2008) and also near the lows of major downtrends.
The strategy also works great for day trading. Spotting the breaking of intraday trends.
Usually upon the breaking of this pattern the momentum picks up.
Meaning a bearish break leads to capitulation and bullish break leads to parabolic move.
Very useful for spotting reversals and a method for trailing stop losses.
----
This is a counter strategy to the butterfly continuation.

Thông báo miễn trừ trách nhiệm
Thông tin và các ấn phẩm này không nhằm mục đích, và không cấu thành, lời khuyên hoặc khuyến nghị về tài chính, đầu tư, giao dịch hay các loại khác do TradingView cung cấp hoặc xác nhận. Đọc thêm tại Điều khoản Sử dụng.
Thông báo miễn trừ trách nhiệm
Thông tin và các ấn phẩm này không nhằm mục đích, và không cấu thành, lời khuyên hoặc khuyến nghị về tài chính, đầu tư, giao dịch hay các loại khác do TradingView cung cấp hoặc xác nhận. Đọc thêm tại Điều khoản Sử dụng.