
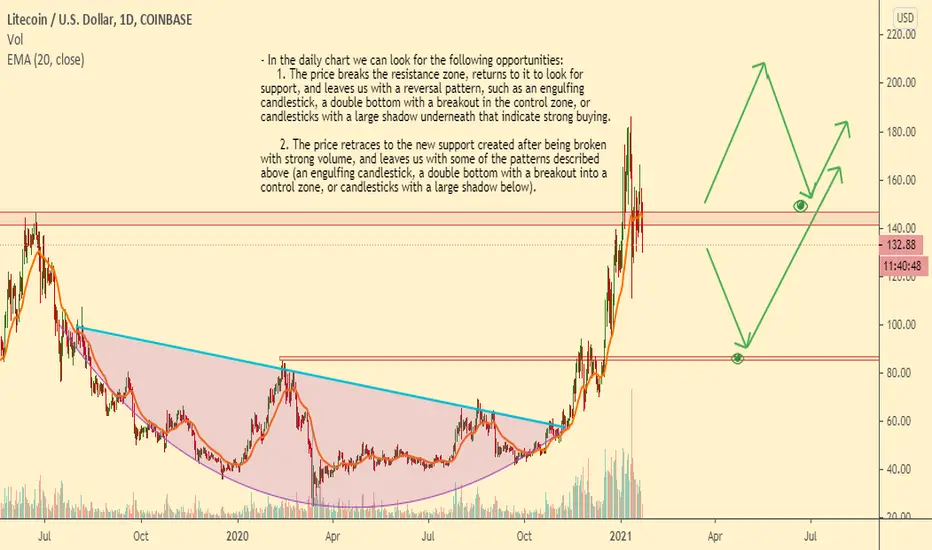
- In the daily chart we can look for the following opportunities:
1. The price breaks the resistance zone, returns to it to look for support, and leaves us with a reversal pattern, such as an engulfing candlestick, a double bottom with a breakout in the control zone, or candlesticks with a large shadow underneath that indicate strong buying.
2. The price retraces to the new support created after being broken with strong volume, and leaves us with some of the patterns described above (an engulfing candlestick, a double bottom with a breakout into a control zone, or candlesticks with a large shadow below).
1. The price breaks the resistance zone, returns to it to look for support, and leaves us with a reversal pattern, such as an engulfing candlestick, a double bottom with a breakout in the control zone, or candlesticks with a large shadow underneath that indicate strong buying.
2. The price retraces to the new support created after being broken with strong volume, and leaves us with some of the patterns described above (an engulfing candlestick, a double bottom with a breakout into a control zone, or candlesticks with a large shadow below).

Thông báo miễn trừ trách nhiệm
Thông tin và các ấn phẩm này không nhằm mục đích, và không cấu thành, lời khuyên hoặc khuyến nghị về tài chính, đầu tư, giao dịch hay các loại khác do TradingView cung cấp hoặc xác nhận. Đọc thêm tại Điều khoản Sử dụng.
Thông báo miễn trừ trách nhiệm
Thông tin và các ấn phẩm này không nhằm mục đích, và không cấu thành, lời khuyên hoặc khuyến nghị về tài chính, đầu tư, giao dịch hay các loại khác do TradingView cung cấp hoặc xác nhận. Đọc thêm tại Điều khoản Sử dụng.