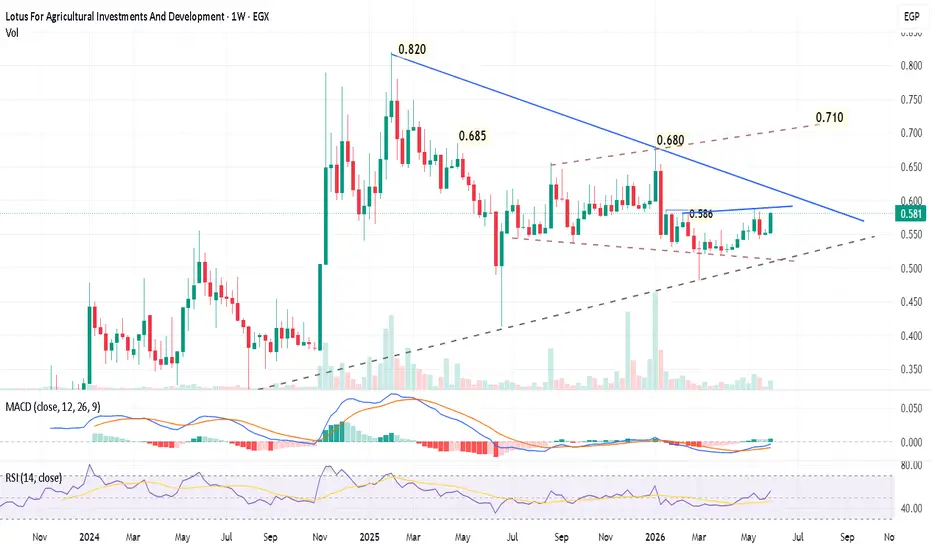
Weekly Chart -  LUTS
1. Chart Pattern & Price Action
Pattern: The chart exhibits a large, developing Symmetrical Triangle or tightening wedge. The primary descending resistance line connects the peaks from 0.820 through 0.680, while a long-term ascending support line (dashed grey) guides the macro trend from late 2024.
Current Setup: Price is currently trading at 0.581, pinning right underneath a local minor horizontal resistance at 0.586 and the major blue descending trendline. The price action has squeezed into a tight consolidation over the last few months, indicating an imminent volatility expansion (breakout or breakdown).
2. Technical Indicators
3. Key Levels & Trading Setup
Immediate Resistance: 0.586 to 0.600 (Intersection of the horizontal level and the primary blue trendline).
Target Levels:
Target 1: 0.680 (Previous major peak).
Target 2: 0.710 (Upper boundary of the secondary brown channel).
Key Support / Stop Loss: 0.550 (Recent swing lows and the ascending support line).
Trading Idea: A decisive weekly close above 0.600 on strong volume confirms a breakout from the multi-month triangle, triggering a buy signal toward 0.680 and 0.710.
Maintain a strict stop loss below 0.550 to protect capital against a failed breakout.
LUTS 1. Chart Pattern & Price Action
Pattern: The chart exhibits a large, developing Symmetrical Triangle or tightening wedge. The primary descending resistance line connects the peaks from 0.820 through 0.680, while a long-term ascending support line (dashed grey) guides the macro trend from late 2024.
Current Setup: Price is currently trading at 0.581, pinning right underneath a local minor horizontal resistance at 0.586 and the major blue descending trendline. The price action has squeezed into a tight consolidation over the last few months, indicating an imminent volatility expansion (breakout or breakdown).
2. Technical Indicators
- MACD: Moving toward a bullish crossover right at the zero line. The histogram shows diminishing bearish momentum (fading pink bars turning to light green), suggesting that selling pressure has dried up and buyers are slowly accumulating.
- RSI (14): Currently sitting at 55.78, recovering steadily above the 50 neutral mark. This indicates a shift back into positive territory without being overbought, leaving plenty of room for an upward run.
3. Key Levels & Trading Setup
Immediate Resistance: 0.586 to 0.600 (Intersection of the horizontal level and the primary blue trendline).
Target Levels:
Target 1: 0.680 (Previous major peak).
Target 2: 0.710 (Upper boundary of the secondary brown channel).
Key Support / Stop Loss: 0.550 (Recent swing lows and the ascending support line).
Trading Idea: A decisive weekly close above 0.600 on strong volume confirms a breakout from the multi-month triangle, triggering a buy signal toward 0.680 and 0.710.
Maintain a strict stop loss below 0.550 to protect capital against a failed breakout.

Thông báo miễn trừ trách nhiệm
Thông tin và các ấn phẩm này không nhằm mục đích, và không cấu thành, lời khuyên hoặc khuyến nghị về tài chính, đầu tư, giao dịch hay các loại khác do TradingView cung cấp hoặc xác nhận. Đọc thêm tại Điều khoản Sử dụng.
Thông báo miễn trừ trách nhiệm
Thông tin và các ấn phẩm này không nhằm mục đích, và không cấu thành, lời khuyên hoặc khuyến nghị về tài chính, đầu tư, giao dịch hay các loại khác do TradingView cung cấp hoặc xác nhận. Đọc thêm tại Điều khoản Sử dụng.