
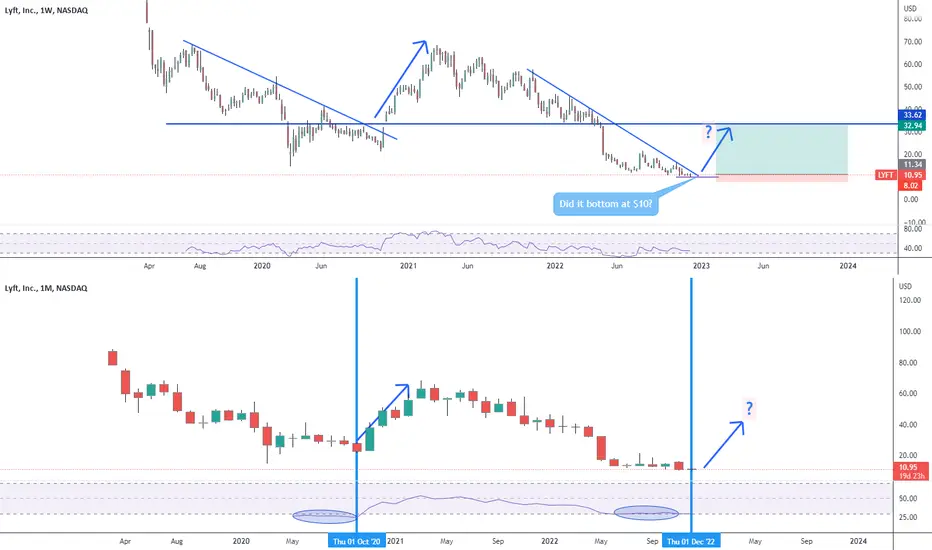
Top chart weekly, bottom chart monthly. See the pattern? The monthly timeframe shows the price has been trading in oversold territory for 5 months, last time that happened the price blew up. I'm opening a small long position on Monday if a see the price trying to break the resistance I'll add.
Giao dịch đang hoạt động
Just added. The $11.50 support level is holding wellGiao dịch đang hoạt động
Well, the $10 is holding well. Still holding my long position. Looks like bulls are coming back.
Thông báo miễn trừ trách nhiệm
Thông tin và các ấn phẩm này không nhằm mục đích, và không cấu thành, lời khuyên hoặc khuyến nghị về tài chính, đầu tư, giao dịch hay các loại khác do TradingView cung cấp hoặc xác nhận. Đọc thêm tại Điều khoản Sử dụng.
Thông báo miễn trừ trách nhiệm
Thông tin và các ấn phẩm này không nhằm mục đích, và không cấu thành, lời khuyên hoặc khuyến nghị về tài chính, đầu tư, giao dịch hay các loại khác do TradingView cung cấp hoặc xác nhận. Đọc thêm tại Điều khoản Sử dụng.