
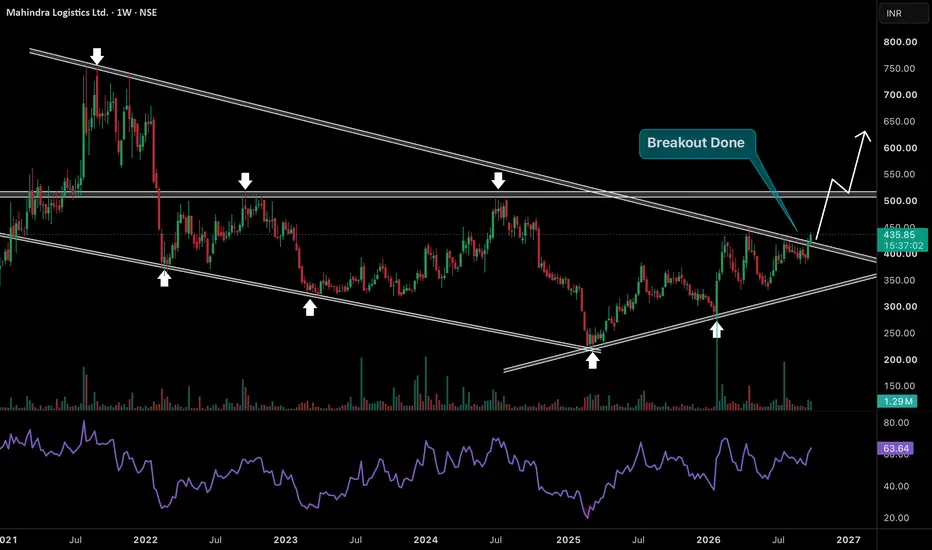
The stock is showing one of the most important structural changes on its weekly chart. The falling trendline has controlled the stock since the 2021 highs and every major rally towards this line was eventually rejected. At the same time price has built a strong reversal structure from the 200–250 zone with higher lows forming throughout 2025–26. Now price has finally pushed above this multi-year trendline around 420–430 and momentum is clearly improving.
If price sustains above this breakout zone the entire character of the chart can change. Sellers who were comfortable selling every rise near this trendline can start getting trapped while fresh buyers enter after confirmation. The next major liquidity and resistance is around 500–515 and a clean break there can open the structure towards 600+. After years of lower prices this breakout can be the beginning of a completely new expansion cycle.
If price sustains above this breakout zone the entire character of the chart can change. Sellers who were comfortable selling every rise near this trendline can start getting trapped while fresh buyers enter after confirmation. The next major liquidity and resistance is around 500–515 and a clean break there can open the structure towards 600+. After years of lower prices this breakout can be the beginning of a completely new expansion cycle.

📌 Join Trading Community 👇
Telegram : 👉telegram.me/chartifyy
Instagram: 👉 instagram.com/chartifyig?igsi=Y2ZiODZtczZ2aDA=&utm_source=qr
Telegram : 👉telegram.me/chartifyy
Instagram: 👉 instagram.com/chartifyig?igsi=Y2ZiODZtczZ2aDA=&utm_source=qr
Thông báo miễn trừ trách nhiệm
Thông tin và các ấn phẩm này không nhằm mục đích, và không cấu thành, lời khuyên hoặc khuyến nghị về tài chính, đầu tư, giao dịch hay các loại khác do TradingView cung cấp hoặc xác nhận. Đọc thêm tại Điều khoản Sử dụng.
📌 Join Trading Community 👇
Telegram : 👉telegram.me/chartifyy
Instagram: 👉 instagram.com/chartifyig?igsi=Y2ZiODZtczZ2aDA=&utm_source=qr
Telegram : 👉telegram.me/chartifyy
Instagram: 👉 instagram.com/chartifyig?igsi=Y2ZiODZtczZ2aDA=&utm_source=qr
Thông báo miễn trừ trách nhiệm
Thông tin và các ấn phẩm này không nhằm mục đích, và không cấu thành, lời khuyên hoặc khuyến nghị về tài chính, đầu tư, giao dịch hay các loại khác do TradingView cung cấp hoặc xác nhận. Đọc thêm tại Điều khoản Sử dụng.