
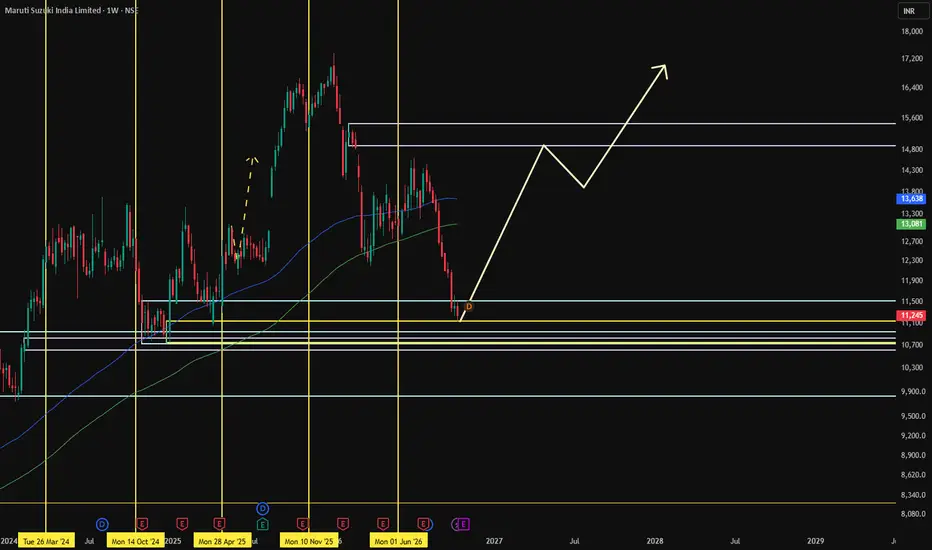
below is the detailed Maruti demand-zone setup across HTF, MTF and ITF, including proximal/distal levels, zone averages, trend, price-action logic and trade execution.
Maruti — Multi-Timeframe Demand Map
1. HTF — Higher-timeframe demand zones
Strategic demand | Yearly, half-yearly and quarterly
Yearly demand
UP
₹9,737 – ₹13,680
Average: ₹11,709 · Rally–Base–Rally
Proximal (upper)
₹13,680
Distal (lower)
₹9,737
Broad strategic zone; the wide range makes confirmation important before entry.
Half-yearly demand
UP
₹12,225 – ₹13,461
Average: ₹12,843 · Rally–Base–Rally
Shared zone with quarterly demand: ₹12,225–₹13,461.
Quarterly demand — BUFL
UP
₹10,725 – ₹13,461
Average: ₹12,093 · DMIP designation in your model
This zone overlaps the half-yearly zone at the top and extends lower to ₹10,725.
HTF takeaway: Your higher-timeframe model remains bullish, with the strongest direct overlap between half-yearly and quarterly demand at ₹12,225–₹13,461. These are broad strategic zones, not automatic entry signals.
2. MTF — Monthly, weekly and daily demand zones
Monthly demand
UP
₹10,725 – ₹11,518
Average: ₹11,122 · DMIP
Main monthly demand reference.
Weekly demand
UP
₹10,725 – ₹11,133
Average: ₹10,929 · DMIP
Overlaps the monthly zone across ₹10,725–₹11,133.
Daily demand
UP
₹10,600 – ₹10,830
Average: ₹10,715 · DMIP
Lower tactical demand zone, also used by all three intraday timeframes.
MTF demand interpretation
- ₹11,133–₹11,518: Upper monthly demand region. A reclaim and hold would be a constructive sign.
- ₹10,725–₹11,133: Main monthly/weekly overlap and an important support area.
- ₹10,600–₹10,830: Daily demand cluster and the lower area of your proposed entries.
- Below ₹10,600: Your planned stop-loss boundary is breached; the proposed trade should not be treated as intact.
3. ITF — Intraday demand zones
Timeframe Proximal Distal Average
240-minute ₹10,830 ₹10,600 ₹10,715
180-minute ₹10,830 ₹10,600 ₹10,715
60-minute ₹10,830 ₹10,600 ₹10,715
ITF average ₹10,830 ₹10,600 ₹10,715
All three zones are identical in your data. This provides a common execution reference, but it should not automatically be counted as three independent confirmations.
Confirmation to watch for: a liquidity sweep, bullish break of structure, strong buying response and a successful retest within the zone. Your supplied figures do not include candle or volume data to verify these signals.
4. Combined demand-zone hierarchy
Demand-zone ladder
Levels arranged from higher price to lower price; not to scale.
HTF overlap
Half-yearly + quarterly
₹12,225–₹13,461
Monthly upper zone
Monthly demand
₹11,133–₹11,518
MTF confluence
Monthly + weekly overlap
₹10,725–₹11,133
Daily + ITF
Daily + 240m + 180m + 60m
₹10,600–₹10,830
Yearly lower boundary
Yearly distal boundary
₹9,737
The bars indicate hierarchy only, not demand strength or probability.
5. Trade setup aligned to demand
Trade parameter Your setup
Entry 1 ₹11,200
Entry 2 ₹10,830
Average entry ₹11,015
Stop-loss ₹10,600
Target ₹14,413
Quantity 400 shares
Gross risk ₹1,66,000
Gross reward ₹13,59,200
Gross RR 8.19:1
Important: Entry 1 at ₹11,200 is within the monthly demand zone. Entry 2 at ₹10,830 sits at the upper boundary of daily and intraday demand. The ₹10,600 stop-loss is the distal boundary of those lower-timeframe zones.
The average entry assumes equal quantities at both prices. If the second entry is not filled, the average entry and risk/reward change.
Final assessment
The strongest feature in your setup is the alignment of monthly, weekly, daily and intraday demand around ₹10,600–₹11,133. The higher-timeframe structure adds broader context, but the trade needs actual price-action confirmation before being considered a validated bullish entry.
Maruti — Multi-Timeframe Demand Map
1. HTF — Higher-timeframe demand zones
Strategic demand | Yearly, half-yearly and quarterly
Yearly demand
UP
₹9,737 – ₹13,680
Average: ₹11,709 · Rally–Base–Rally
Proximal (upper)
₹13,680
Distal (lower)
₹9,737
Broad strategic zone; the wide range makes confirmation important before entry.
Half-yearly demand
UP
₹12,225 – ₹13,461
Average: ₹12,843 · Rally–Base–Rally
Shared zone with quarterly demand: ₹12,225–₹13,461.
Quarterly demand — BUFL
UP
₹10,725 – ₹13,461
Average: ₹12,093 · DMIP designation in your model
This zone overlaps the half-yearly zone at the top and extends lower to ₹10,725.
HTF takeaway: Your higher-timeframe model remains bullish, with the strongest direct overlap between half-yearly and quarterly demand at ₹12,225–₹13,461. These are broad strategic zones, not automatic entry signals.
2. MTF — Monthly, weekly and daily demand zones
Monthly demand
UP
₹10,725 – ₹11,518
Average: ₹11,122 · DMIP
Main monthly demand reference.
Weekly demand
UP
₹10,725 – ₹11,133
Average: ₹10,929 · DMIP
Overlaps the monthly zone across ₹10,725–₹11,133.
Daily demand
UP
₹10,600 – ₹10,830
Average: ₹10,715 · DMIP
Lower tactical demand zone, also used by all three intraday timeframes.
MTF demand interpretation
- ₹11,133–₹11,518: Upper monthly demand region. A reclaim and hold would be a constructive sign.
- ₹10,725–₹11,133: Main monthly/weekly overlap and an important support area.
- ₹10,600–₹10,830: Daily demand cluster and the lower area of your proposed entries.
- Below ₹10,600: Your planned stop-loss boundary is breached; the proposed trade should not be treated as intact.
3. ITF — Intraday demand zones
Timeframe Proximal Distal Average
240-minute ₹10,830 ₹10,600 ₹10,715
180-minute ₹10,830 ₹10,600 ₹10,715
60-minute ₹10,830 ₹10,600 ₹10,715
ITF average ₹10,830 ₹10,600 ₹10,715
All three zones are identical in your data. This provides a common execution reference, but it should not automatically be counted as three independent confirmations.
Confirmation to watch for: a liquidity sweep, bullish break of structure, strong buying response and a successful retest within the zone. Your supplied figures do not include candle or volume data to verify these signals.
4. Combined demand-zone hierarchy
Demand-zone ladder
Levels arranged from higher price to lower price; not to scale.
HTF overlap
Half-yearly + quarterly
₹12,225–₹13,461
Monthly upper zone
Monthly demand
₹11,133–₹11,518
MTF confluence
Monthly + weekly overlap
₹10,725–₹11,133
Daily + ITF
Daily + 240m + 180m + 60m
₹10,600–₹10,830
Yearly lower boundary
Yearly distal boundary
₹9,737
The bars indicate hierarchy only, not demand strength or probability.
5. Trade setup aligned to demand
Trade parameter Your setup
Entry 1 ₹11,200
Entry 2 ₹10,830
Average entry ₹11,015
Stop-loss ₹10,600
Target ₹14,413
Quantity 400 shares
Gross risk ₹1,66,000
Gross reward ₹13,59,200
Gross RR 8.19:1
Important: Entry 1 at ₹11,200 is within the monthly demand zone. Entry 2 at ₹10,830 sits at the upper boundary of daily and intraday demand. The ₹10,600 stop-loss is the distal boundary of those lower-timeframe zones.
The average entry assumes equal quantities at both prices. If the second entry is not filled, the average entry and risk/reward change.
Final assessment
The strongest feature in your setup is the alignment of monthly, weekly, daily and intraday demand around ₹10,600–₹11,133. The higher-timeframe structure adds broader context, but the trade needs actual price-action confirmation before being considered a validated bullish entry.

Thông báo miễn trừ trách nhiệm
Thông tin và các ấn phẩm này không nhằm mục đích, và không cấu thành, lời khuyên hoặc khuyến nghị về tài chính, đầu tư, giao dịch hay các loại khác do TradingView cung cấp hoặc xác nhận. Đọc thêm tại Điều khoản Sử dụng.
Thông báo miễn trừ trách nhiệm
Thông tin và các ấn phẩm này không nhằm mục đích, và không cấu thành, lời khuyên hoặc khuyến nghị về tài chính, đầu tư, giao dịch hay các loại khác do TradingView cung cấp hoặc xác nhận. Đọc thêm tại Điều khoản Sử dụng.