MATIC 1D Interval Review
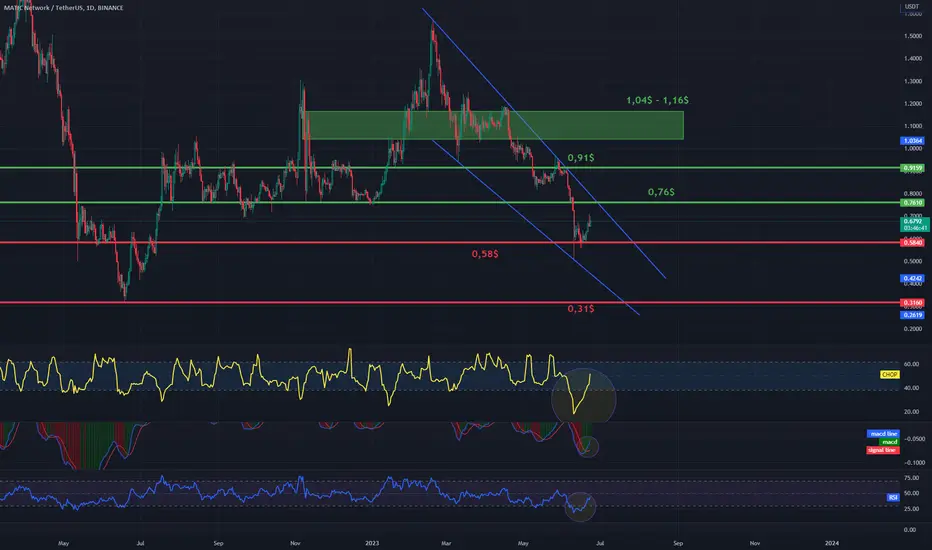
The last one in today's chart is the MATIC chart in pair to USDT, on a one-day interval. First, we will use the blue lines to mark the downtrend channel where the price is moving in the upper range.
Moving on, we can move on to marking support areas when the price returns to a correction. And here the first very strong support that has kept the price so far is at $ 0.58, but if we fall lower, the next support is at $ 0.31.
Looking the other way, we see that the price has to face the $0.76 resistance, only when it breaks it will move towards the $0.91 resistance and then towards the very strong $1.04 to $1,16 resistance zone.
Please look at the CHOP index, which indicates that we have more and more energy, the MACD indicates a downtrend, while the RSI shows that a small price increase gives a strong movement on the indicator, which can quickly limit the room for further increases, in the coming hours we can see further growth.
Moving on, we can move on to marking support areas when the price returns to a correction. And here the first very strong support that has kept the price so far is at $ 0.58, but if we fall lower, the next support is at $ 0.31.
Looking the other way, we see that the price has to face the $0.76 resistance, only when it breaks it will move towards the $0.91 resistance and then towards the very strong $1.04 to $1,16 resistance zone.
Please look at the CHOP index, which indicates that we have more and more energy, the MACD indicates a downtrend, while the RSI shows that a small price increase gives a strong movement on the indicator, which can quickly limit the room for further increases, in the coming hours we can see further growth.

Thông báo miễn trừ trách nhiệm
Thông tin và các ấn phẩm này không nhằm mục đích, và không cấu thành, lời khuyên hoặc khuyến nghị về tài chính, đầu tư, giao dịch hay các loại khác do TradingView cung cấp hoặc xác nhận. Đọc thêm tại Điều khoản Sử dụng.
Thông báo miễn trừ trách nhiệm
Thông tin và các ấn phẩm này không nhằm mục đích, và không cấu thành, lời khuyên hoặc khuyến nghị về tài chính, đầu tư, giao dịch hay các loại khác do TradingView cung cấp hoặc xác nhận. Đọc thêm tại Điều khoản Sử dụng.