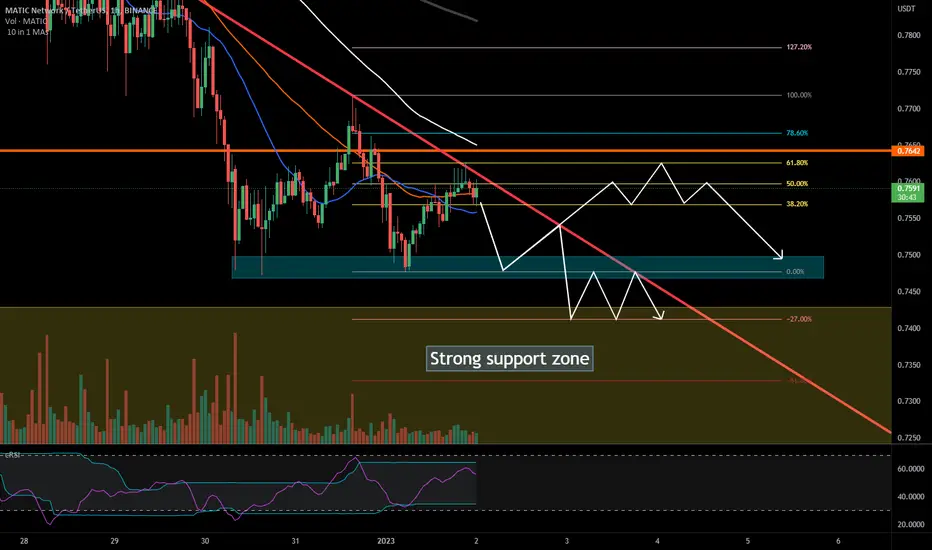
2 possible MATIC trajectories
$BINANCE:MATICUSDT
The price is near a very strong support zone . If the price bounces once again against the red trendline as shown on the chart, it is most likely to fall to the support zone drawn approximately to the -27% Fibonacci level. If the trendline is not respected and a strong bullish candle closes above the red trendline, it is most likely that the price will rise to the 61.8% Fibonacci level, coinciding approximately with a previous high.
The price is near a very strong support zone . If the price bounces once again against the red trendline as shown on the chart, it is most likely to fall to the support zone drawn approximately to the -27% Fibonacci level. If the trendline is not respected and a strong bullish candle closes above the red trendline, it is most likely that the price will rise to the 61.8% Fibonacci level, coinciding approximately with a previous high.

Thông báo miễn trừ trách nhiệm
Thông tin và các ấn phẩm này không nhằm mục đích, và không cấu thành, lời khuyên hoặc khuyến nghị về tài chính, đầu tư, giao dịch hay các loại khác do TradingView cung cấp hoặc xác nhận. Đọc thêm tại Điều khoản Sử dụng.
Thông báo miễn trừ trách nhiệm
Thông tin và các ấn phẩm này không nhằm mục đích, và không cấu thành, lời khuyên hoặc khuyến nghị về tài chính, đầu tư, giao dịch hay các loại khác do TradingView cung cấp hoặc xác nhận. Đọc thêm tại Điều khoản Sử dụng.