MATICUSDT market structure
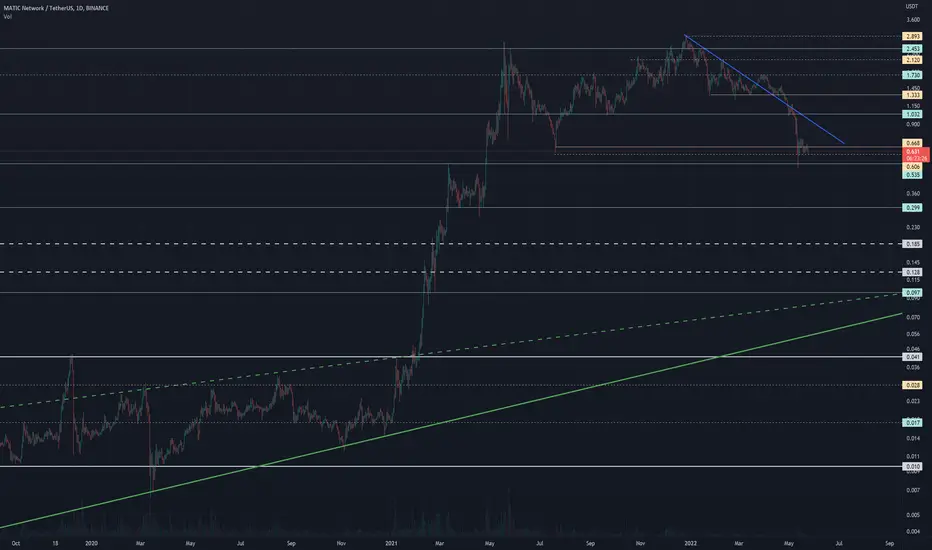
Strong levels represented by solid lines.
Less significant levels represented by dashed lines.
Trendlines represented by slanted lines.
More often than not, price action is choppy with much overlap between candles. Strictly following definitions for swing high/low could leave us with a market structure that is just unworkable. Our intent is simply to identify those key turning points which stand out on the chart as the most obvious levels, and therefore offer potential barriers to future price action.

Thông báo miễn trừ trách nhiệm
Thông tin và các ấn phẩm này không nhằm mục đích, và không cấu thành, lời khuyên hoặc khuyến nghị về tài chính, đầu tư, giao dịch hay các loại khác do TradingView cung cấp hoặc xác nhận. Đọc thêm tại Điều khoản Sử dụng.
Thông báo miễn trừ trách nhiệm
Thông tin và các ấn phẩm này không nhằm mục đích, và không cấu thành, lời khuyên hoặc khuyến nghị về tài chính, đầu tư, giao dịch hay các loại khác do TradingView cung cấp hoặc xác nhận. Đọc thêm tại Điều khoản Sử dụng.