
🎯 Objective
This study evaluates how **consensus technology stock recommendations** from leading financial publications performed across four different investment horizons compared with three widely followed benchmarks:
- 📈 S&P 500
- 🥇 Gold
- ₿ Bitcoin
Four historical recommendation baskets (approximately **10-year, 5-year, 3-year, and 1-year**) were constructed and evaluated using two investor-focused performance metrics:
- Total Return** (including dividends where applicable)
- Maximum Drawdown** (largest peak-to-trough decline)
The objective was to evaluate not only which investments generated the highest returns, but also the level of risk investors experienced while achieving those returns.
---
🛠️ Methodology
1. Basket Construction
For each investment period, technology stocks were selected from recommendations published by leading financial publications and research platforms *(e.g., Motley Fool, Barron's, Morningstar, MarketWatch, TipRanks, and Seeking Alpha)* near the beginning of each period. Stocks were ranked by recommendation frequency across multiple sources to produce a consensus basket. Selections were independently cross-checked to ensure consistency.
2. Performance Measurement
Each basket was evaluated from its respective start date through a common end date using:
* Total Return** based on adjusted closing prices *(including dividends and splits)*.
* Maximum Drawdown**, measuring the largest decline from a previous peak.
* An **equal-weight buy-and-hold portfolio** was created for each basket to measure overall portfolio-level performance and drawdown.
3. Benchmarks & Data
* Benchmarks:** S&P 500, Gold, and Bitcoin over the exact same investment windows.
* Data Source:** Historical market data obtained from Yahoo Finance and processed via Python in Google Colab using a consistent, reproducible framework.
---
📈 Results
✅ Return: Basket vs. Benchmarks
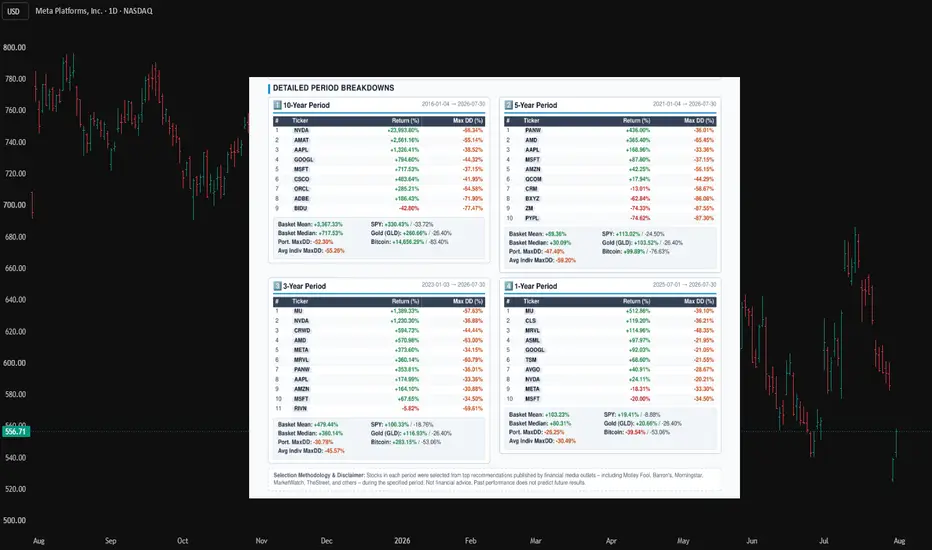
- 🚀 **2016 Basket:** Mean return **+3,367%**, comfortably outperforming the **S&P 500 (+330%)** and **Gold (+261%)**, although Bitcoin produced an extraordinary **+14,656%**. NVIDIA (+23,994%) accounted for much of the basket's exceptional performance.
- ⚠️ **2021 Basket:** Mean return **+89%**, underperforming both the **S&P 500 (+113%)** and **Gold (+104%)**. This was the only period where consensus technology selections failed to beat a passive index, largely due to severe declines in PayPal, Zoom and Block.
- 🏆 **2023 Basket:** Mean return **+479%**, decisively outperforming the **S&P 500 (+100%)**, **Gold (+117%)**, and **Bitcoin (+283%)**, making it the strongest overall basket in the study.
- 📈 **2025 Basket:** Mean return **+103%**, substantially outperforming both the **S&P 500 (+19%)** and **Gold (+21%)**, while Bitcoin declined **−40%** over the same period.
---
⚠️ Risk: Maximum Drawdown & Diversification
- ✅ The **largest diversification benefit** occurred in the **2021** and **2023** baskets, where the portfolio's maximum drawdown was **11.8** and **14.8 percentage points** smaller than the average drawdown of the individual stocks.
- ⚠️ Every technology basket experienced a **larger maximum drawdown** than the S&P 500 over the same investment period, demonstrating that higher returns required accepting greater volatility.
- 🥇 Gold produced the **same maximum drawdown (-26.4%)** across all four investment windows because its largest decline occurred entirely within **Jan–Jul 2026**.
- ₿ Bitcoin's maximum drawdown depended heavily on the observation window:
- **−83.4%** (2017–18 crash) appears only in the 10-year study.
- **−76.6%** (2021–22 crash) appears in windows of approximately five years or longer.
- Shorter windows capture only the more recent **−53.1%** correction (Oct 2025–Jun 2026).
---
## ⭐ Durable Favorites
Several companies appeared repeatedly across multiple recommendation periods:
- 🍎 Apple — 2016, 2021, 2023
- 🪟 Microsoft — All four baskets
- 🚀 NVIDIA — 2016, 2023, 2025
- 💾 Marvell Technology — Two baskets
- 🔒 Palo Alto Networks — Two baskets
---
🏆 Biggest Winners
- 🚀 **NVIDIA (2016):** **+23,994%**, the highest return in the entire study despite experiencing a **−66.3%** maximum drawdown.
- 💾 **Micron Technology:** Ranked #1 in both the **2023 (+1,389%)** and **2025 (+513%)** baskets.
- 🛡️ **CrowdStrike:** Returned **+595%** over three years despite a major outage-related setback and a **−44.4%** maximum drawdown.
---
❌ Biggest Disappointments
- 📉 **PayPal, Zoom and Block (2021):**
- Returns between **−63%** and **−75%**
- Maximum drawdowns between **−86%** and **−88%**
- Worst combination of return and risk in the entire study.
- 📉 **Baidu (2016):**
- Return: **−43%**
- Maximum Drawdown: **−77%**
- 📉 **Rivian (2023):**
- Return: **−6%**
- Maximum Drawdown: **−70%**
---
📌 Conclusion
Across four investment horizons, consensus technology stock recommendations generally outperformed traditional benchmarks, beating both the **S&P 500** and **Gold** in **three of the four** study periods.
The principal exception was the **2021 basket**, which was assembled near the peak of the post-pandemic growth-stock cycle. As interest rates increased and market leadership shifted, many high-growth technology companies experienced substantial valuation contractions, causing the basket to underperform the S&P 500.
In contrast, the **2023 basket** benefited from the powerful technology-led bull market driven by artificial intelligence and semiconductor demand, producing the strongest broad-based outperformance of the study.
The results also demonstrate the importance of **diversification**. Although individual technology stocks frequently experienced severe drawdowns, equal-weighted baskets consistently reduced portfolio risk relative to holding individual stocks alone.
Nevertheless, superior returns were accompanied by **higher volatility**. Every technology basket experienced a larger maximum drawdown than the S&P 500 over the corresponding investment period, illustrating that higher long-term returns required accepting substantially larger interim losses.
Several companies—including **Microsoft, NVIDIA, Apple, Micron Technology, and Palo Alto Networks**—appeared repeatedly across multiple recommendation periods, suggesting persistent analyst conviction across changing market environments. However, the study also highlights that consensus recommendations are not infallible, with companies such as **PayPal, Zoom, Block, Baidu, and Rivian** producing poor long-term outcomes.
Overall, the findings suggest that a diversified basket of consensus technology recommendations has historically been a competitive long-term investment approach. However, investment outcomes remain highly dependent on the prevailing market regime: post-bubble corrections and rising interest rates can significantly impair performance, while innovation-driven bull markets can create exceptional opportunities for technology leaders.
This study evaluates how **consensus technology stock recommendations** from leading financial publications performed across four different investment horizons compared with three widely followed benchmarks:
- 📈 S&P 500
- 🥇 Gold
- ₿ Bitcoin
Four historical recommendation baskets (approximately **10-year, 5-year, 3-year, and 1-year**) were constructed and evaluated using two investor-focused performance metrics:
- Total Return** (including dividends where applicable)
- Maximum Drawdown** (largest peak-to-trough decline)
The objective was to evaluate not only which investments generated the highest returns, but also the level of risk investors experienced while achieving those returns.
---
🛠️ Methodology
1. Basket Construction
For each investment period, technology stocks were selected from recommendations published by leading financial publications and research platforms *(e.g., Motley Fool, Barron's, Morningstar, MarketWatch, TipRanks, and Seeking Alpha)* near the beginning of each period. Stocks were ranked by recommendation frequency across multiple sources to produce a consensus basket. Selections were independently cross-checked to ensure consistency.
2. Performance Measurement
Each basket was evaluated from its respective start date through a common end date using:
* Total Return** based on adjusted closing prices *(including dividends and splits)*.
* Maximum Drawdown**, measuring the largest decline from a previous peak.
* An **equal-weight buy-and-hold portfolio** was created for each basket to measure overall portfolio-level performance and drawdown.
3. Benchmarks & Data
* Benchmarks:** S&P 500, Gold, and Bitcoin over the exact same investment windows.
* Data Source:** Historical market data obtained from Yahoo Finance and processed via Python in Google Colab using a consistent, reproducible framework.
---
📈 Results
✅ Return: Basket vs. Benchmarks
- 🚀 **2016 Basket:** Mean return **+3,367%**, comfortably outperforming the **S&P 500 (+330%)** and **Gold (+261%)**, although Bitcoin produced an extraordinary **+14,656%**. NVIDIA (+23,994%) accounted for much of the basket's exceptional performance.
- ⚠️ **2021 Basket:** Mean return **+89%**, underperforming both the **S&P 500 (+113%)** and **Gold (+104%)**. This was the only period where consensus technology selections failed to beat a passive index, largely due to severe declines in PayPal, Zoom and Block.
- 🏆 **2023 Basket:** Mean return **+479%**, decisively outperforming the **S&P 500 (+100%)**, **Gold (+117%)**, and **Bitcoin (+283%)**, making it the strongest overall basket in the study.
- 📈 **2025 Basket:** Mean return **+103%**, substantially outperforming both the **S&P 500 (+19%)** and **Gold (+21%)**, while Bitcoin declined **−40%** over the same period.
---
⚠️ Risk: Maximum Drawdown & Diversification
- ✅ The **largest diversification benefit** occurred in the **2021** and **2023** baskets, where the portfolio's maximum drawdown was **11.8** and **14.8 percentage points** smaller than the average drawdown of the individual stocks.
- ⚠️ Every technology basket experienced a **larger maximum drawdown** than the S&P 500 over the same investment period, demonstrating that higher returns required accepting greater volatility.
- 🥇 Gold produced the **same maximum drawdown (-26.4%)** across all four investment windows because its largest decline occurred entirely within **Jan–Jul 2026**.
- ₿ Bitcoin's maximum drawdown depended heavily on the observation window:
- **−83.4%** (2017–18 crash) appears only in the 10-year study.
- **−76.6%** (2021–22 crash) appears in windows of approximately five years or longer.
- Shorter windows capture only the more recent **−53.1%** correction (Oct 2025–Jun 2026).
---
## ⭐ Durable Favorites
Several companies appeared repeatedly across multiple recommendation periods:
- 🍎 Apple — 2016, 2021, 2023
- 🪟 Microsoft — All four baskets
- 🚀 NVIDIA — 2016, 2023, 2025
- 💾 Marvell Technology — Two baskets
- 🔒 Palo Alto Networks — Two baskets
---
🏆 Biggest Winners
- 🚀 **NVIDIA (2016):** **+23,994%**, the highest return in the entire study despite experiencing a **−66.3%** maximum drawdown.
- 💾 **Micron Technology:** Ranked #1 in both the **2023 (+1,389%)** and **2025 (+513%)** baskets.
- 🛡️ **CrowdStrike:** Returned **+595%** over three years despite a major outage-related setback and a **−44.4%** maximum drawdown.
---
❌ Biggest Disappointments
- 📉 **PayPal, Zoom and Block (2021):**
- Returns between **−63%** and **−75%**
- Maximum drawdowns between **−86%** and **−88%**
- Worst combination of return and risk in the entire study.
- 📉 **Baidu (2016):**
- Return: **−43%**
- Maximum Drawdown: **−77%**
- 📉 **Rivian (2023):**
- Return: **−6%**
- Maximum Drawdown: **−70%**
---
📌 Conclusion
Across four investment horizons, consensus technology stock recommendations generally outperformed traditional benchmarks, beating both the **S&P 500** and **Gold** in **three of the four** study periods.
The principal exception was the **2021 basket**, which was assembled near the peak of the post-pandemic growth-stock cycle. As interest rates increased and market leadership shifted, many high-growth technology companies experienced substantial valuation contractions, causing the basket to underperform the S&P 500.
In contrast, the **2023 basket** benefited from the powerful technology-led bull market driven by artificial intelligence and semiconductor demand, producing the strongest broad-based outperformance of the study.
The results also demonstrate the importance of **diversification**. Although individual technology stocks frequently experienced severe drawdowns, equal-weighted baskets consistently reduced portfolio risk relative to holding individual stocks alone.
Nevertheless, superior returns were accompanied by **higher volatility**. Every technology basket experienced a larger maximum drawdown than the S&P 500 over the corresponding investment period, illustrating that higher long-term returns required accepting substantially larger interim losses.
Several companies—including **Microsoft, NVIDIA, Apple, Micron Technology, and Palo Alto Networks**—appeared repeatedly across multiple recommendation periods, suggesting persistent analyst conviction across changing market environments. However, the study also highlights that consensus recommendations are not infallible, with companies such as **PayPal, Zoom, Block, Baidu, and Rivian** producing poor long-term outcomes.
Overall, the findings suggest that a diversified basket of consensus technology recommendations has historically been a competitive long-term investment approach. However, investment outcomes remain highly dependent on the prevailing market regime: post-bubble corrections and rising interest rates can significantly impair performance, while innovation-driven bull markets can create exceptional opportunities for technology leaders.

Thông báo miễn trừ trách nhiệm
Thông tin và các ấn phẩm này không nhằm mục đích, và không cấu thành, lời khuyên hoặc khuyến nghị về tài chính, đầu tư, giao dịch hay các loại khác do TradingView cung cấp hoặc xác nhận. Đọc thêm tại Điều khoản Sử dụng.
Thông báo miễn trừ trách nhiệm
Thông tin và các ấn phẩm này không nhằm mục đích, và không cấu thành, lời khuyên hoặc khuyến nghị về tài chính, đầu tư, giao dịch hay các loại khác do TradingView cung cấp hoặc xác nhận. Đọc thêm tại Điều khoản Sử dụng.