Giá mua
Mainframe Chart Analysis | 700%+ Long-term Profits Potential
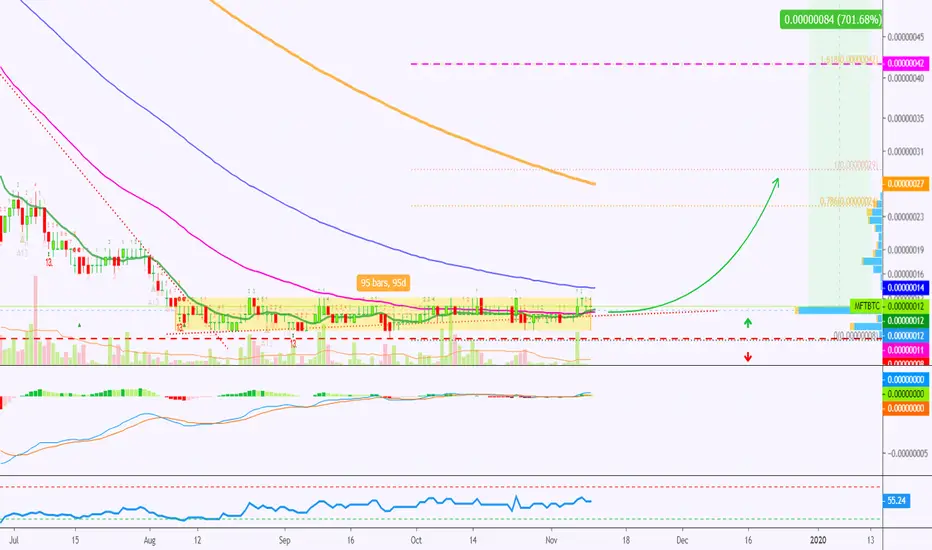
Mainframe (MFTBTC) has been consolidating for long and is getting ready to move big time.
We have green volume coming in as well as EMA10 and EMA50 already conquered on the daily (D) time frame.
Both the MACD and RSI are in the bullish zone.
When you look at the weekly chart for Mainframe (MFTBTC), you can see that this pair is now trading above EMA10 (green line).
Here:
We can also notice a long consolidation period (orange), lasting more than 95 days and can still go longer but a breakout to the upside and trend reversal should be happening soon.
We can also appreciate the long-term profits potential on the chart above.
Thanks a lot for reading.
Namaste.
Ghi chú
(1) 16 |Hit 18-Nov. (+33%)
💯 Trading signals (results)
— Late 2026👇
t.me/masteranandatrades/9279
🔥 10-25X Leverage
—Trade-numbers:
t.me/masteranandatrades/9271
✅ PREMIUM &Content
—One-Time Payment
t.me/lamatrades/4 (🔝 since 2017)
— Late 2026👇
t.me/masteranandatrades/9279
🔥 10-25X Leverage
—Trade-numbers:
t.me/masteranandatrades/9271
✅ PREMIUM &Content
—One-Time Payment
t.me/lamatrades/4 (🔝 since 2017)
Bài đăng liên quan
Thông báo miễn trừ trách nhiệm
Thông tin và các ấn phẩm này không nhằm mục đích, và không cấu thành, lời khuyên hoặc khuyến nghị về tài chính, đầu tư, giao dịch hay các loại khác do TradingView cung cấp hoặc xác nhận. Đọc thêm tại Điều khoản Sử dụng.