Short
Maker
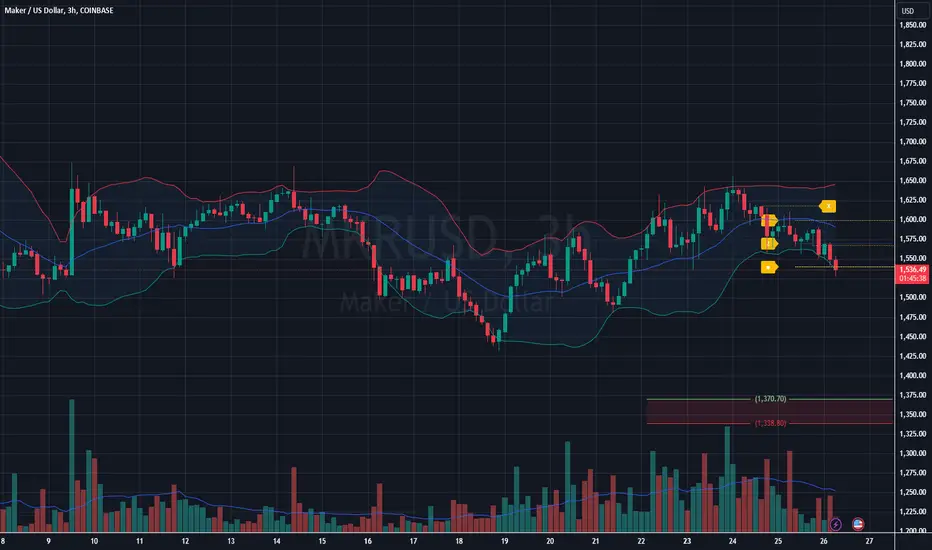
- The price has consistently made lower highs and lower lows, indicating sustained bearish momentum.
- The bands are expanding, which indicates an increase in volatility.
- There seems to be a 20-period moving average (middle line of the Bollinger Bands), which the price recently crossed below. This signals bearish momentum.
- There are a few spikes in volume, particularly during the large price drops. This increase in volume during sell-offs suggests strong selling pressure.
- Support: The nearest support is around $1,431.81, which is the lowest price visible in the chart. If the price breaks below this level, it may head towards lower support zones.
- Bearish Bias: The price action, moving averages, and positioning near the lower Bollinger Band suggest a bearish trend.

➀➁➂➃➄
Thông báo miễn trừ trách nhiệm
Thông tin và các ấn phẩm này không nhằm mục đích, và không cấu thành, lời khuyên hoặc khuyến nghị về tài chính, đầu tư, giao dịch hay các loại khác do TradingView cung cấp hoặc xác nhận. Đọc thêm tại Điều khoản Sử dụng.
➀➁➂➃➄
Thông báo miễn trừ trách nhiệm
Thông tin và các ấn phẩm này không nhằm mục đích, và không cấu thành, lời khuyên hoặc khuyến nghị về tài chính, đầu tư, giao dịch hay các loại khác do TradingView cung cấp hoặc xác nhận. Đọc thêm tại Điều khoản Sử dụng.