
Hi traders
Ever woundered - "can i beat the market ?" or "what is my Edge ?"
try the 70 Ema !!
i will use daily chart
and look for clear trend direction
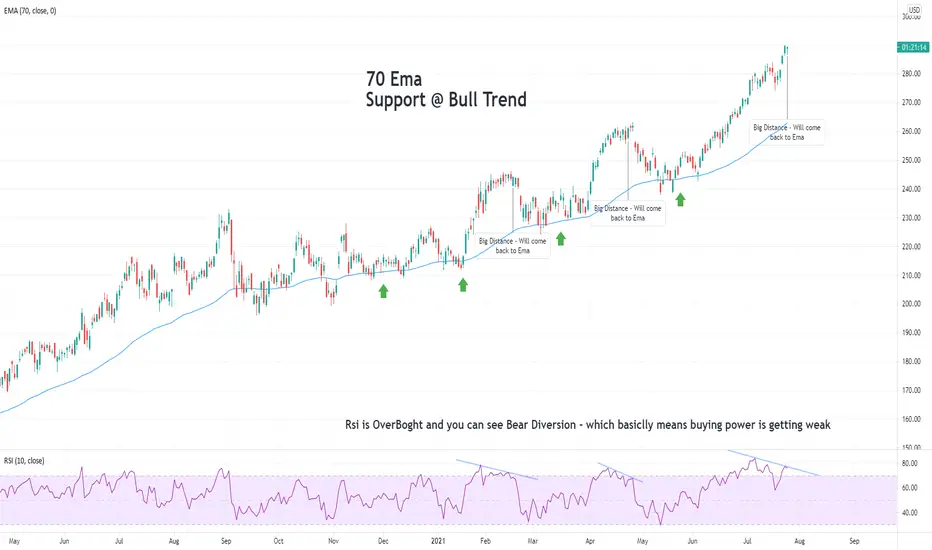
apply indicator called Moving Avarage Exponential and set it to 70
-- UPTREND --
on an uptrend look if the line support the price.
you will want to go long when price reach the blue line.
on the other hand, price tends to "come back" to the Ema, so you can try short if price is to far up (see microsoft chart)
combined with RSI indicator, you can get better feeling if the price is overboght (and go short) or oversold (and go long)
-- DOWNTREND --
On downtrend the 70 Ema will act as RESISTANCE - see BABA chart
same here - price tends to "come back" to the Ema ...
Good Luck
Ever woundered - "can i beat the market ?" or "what is my Edge ?"
try the 70 Ema !!
i will use daily chart
and look for clear trend direction
apply indicator called Moving Avarage Exponential and set it to 70
-- UPTREND --
on an uptrend look if the line support the price.
you will want to go long when price reach the blue line.
on the other hand, price tends to "come back" to the Ema, so you can try short if price is to far up (see microsoft chart)
combined with RSI indicator, you can get better feeling if the price is overboght (and go short) or oversold (and go long)
-- DOWNTREND --
On downtrend the 70 Ema will act as RESISTANCE - see
BABA chart same here - price tends to "come back" to the Ema ...
Good Luck
Ghi chú
DowntrendBABAGhi chú
Price will come back to EMA

Thông báo miễn trừ trách nhiệm
Thông tin và các ấn phẩm này không nhằm mục đích, và không cấu thành, lời khuyên hoặc khuyến nghị về tài chính, đầu tư, giao dịch hay các loại khác do TradingView cung cấp hoặc xác nhận. Đọc thêm tại Điều khoản Sử dụng.
Thông báo miễn trừ trách nhiệm
Thông tin và các ấn phẩm này không nhằm mục đích, và không cấu thành, lời khuyên hoặc khuyến nghị về tài chính, đầu tư, giao dịch hay các loại khác do TradingView cung cấp hoặc xác nhận. Đọc thêm tại Điều khoản Sử dụng.