
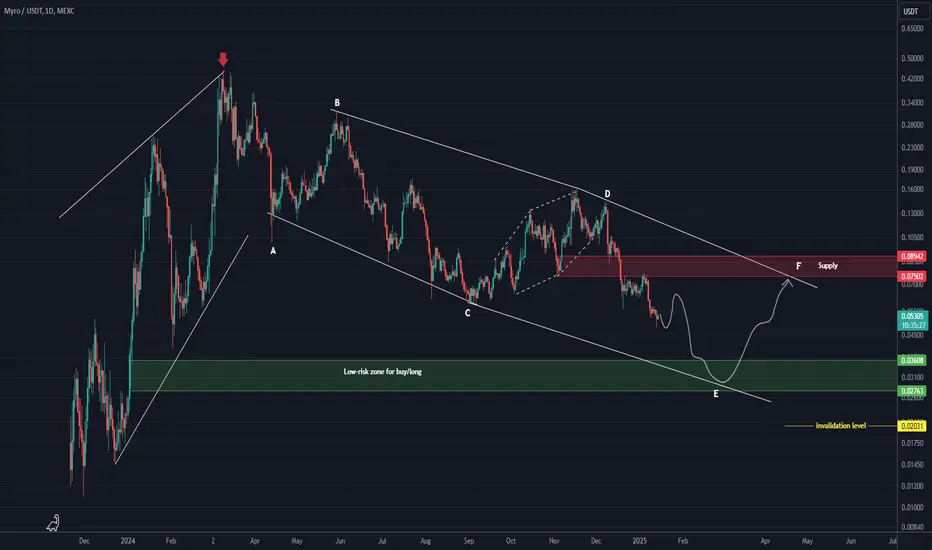
From the point where we placed the red arrow on the chart, it seems that MYRO's correction has begun.
This correction appears to be a diametric pattern, and we are currently in wave E of this diametric, which is a bearish wave.
The green zone represents a low-risk area for buy/long positions.
The closure of a daily candle below the invalidation level will invalidate this analysis.
For risk management, please don't forget stop loss and capital management
Comment if you have any questions
Thank You
This correction appears to be a diametric pattern, and we are currently in wave E of this diametric, which is a bearish wave.
The green zone represents a low-risk area for buy/long positions.
The closure of a daily candle below the invalidation level will invalidate this analysis.
For risk management, please don't forget stop loss and capital management
Comment if you have any questions
Thank You

✅ Join our Telegram channel to succeed in trading.
💎Our CRYPTO Telegram Channel: 👉 t.me/Behdark_EN
💎Our FOREX Telegram Channel: 👉 t.me/FX_Behdark
💎Our CRYPTO Telegram Channel: 👉 t.me/Behdark_EN
💎Our FOREX Telegram Channel: 👉 t.me/FX_Behdark
Thông báo miễn trừ trách nhiệm
Thông tin và các ấn phẩm này không nhằm mục đích, và không cấu thành, lời khuyên hoặc khuyến nghị về tài chính, đầu tư, giao dịch hay các loại khác do TradingView cung cấp hoặc xác nhận. Đọc thêm tại Điều khoản Sử dụng.
✅ Join our Telegram channel to succeed in trading.
💎Our CRYPTO Telegram Channel: 👉 t.me/Behdark_EN
💎Our FOREX Telegram Channel: 👉 t.me/FX_Behdark
💎Our CRYPTO Telegram Channel: 👉 t.me/Behdark_EN
💎Our FOREX Telegram Channel: 👉 t.me/FX_Behdark
Thông báo miễn trừ trách nhiệm
Thông tin và các ấn phẩm này không nhằm mục đích, và không cấu thành, lời khuyên hoặc khuyến nghị về tài chính, đầu tư, giao dịch hay các loại khác do TradingView cung cấp hoặc xác nhận. Đọc thêm tại Điều khoản Sử dụng.