
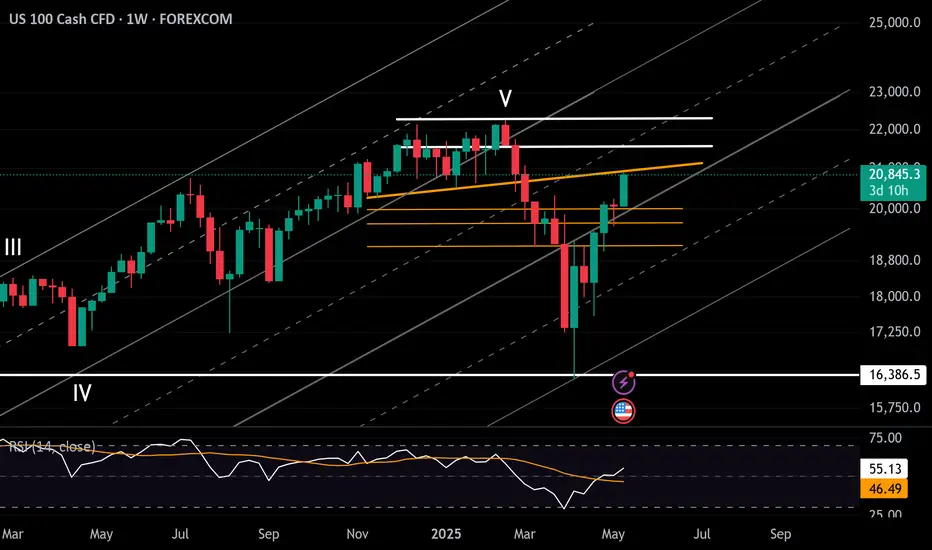
As shown in chart above, price action is hovering near the neckline of a well-defined double top pattern, formed between December 2024 and February 2025, similarly across the Dow and SPX500 charts.
This reinforces a key resistance zone that could either validate a more sustainable bullish outlook into 2025 — or trigger another correction if rejected.
Nasdaq Upside Scenario: A confirmed hold above 20,900 may extend gains toward 21,500, and 22,200.
Downside Scenario: A pullback below 20900 and 20,500 could find support at 20,200, 19,600, and 19,170, respectively.
Markets are currently holding on trade optimism, yet key economic reports are likely to test the narrative
Written by Razan Hilal, CMT
This reinforces a key resistance zone that could either validate a more sustainable bullish outlook into 2025 — or trigger another correction if rejected.
Nasdaq Upside Scenario: A confirmed hold above 20,900 may extend gains toward 21,500, and 22,200.
Downside Scenario: A pullback below 20900 and 20,500 could find support at 20,200, 19,600, and 19,170, respectively.
Markets are currently holding on trade optimism, yet key economic reports are likely to test the narrative
Written by Razan Hilal, CMT

Thông báo miễn trừ trách nhiệm
Thông tin và các ấn phẩm này không nhằm mục đích, và không cấu thành, lời khuyên hoặc khuyến nghị về tài chính, đầu tư, giao dịch hay các loại khác do TradingView cung cấp hoặc xác nhận. Đọc thêm tại Điều khoản Sử dụng.
Thông báo miễn trừ trách nhiệm
Thông tin và các ấn phẩm này không nhằm mục đích, và không cấu thành, lời khuyên hoặc khuyến nghị về tài chính, đầu tư, giao dịch hay các loại khác do TradingView cung cấp hoặc xác nhận. Đọc thêm tại Điều khoản Sử dụng.