
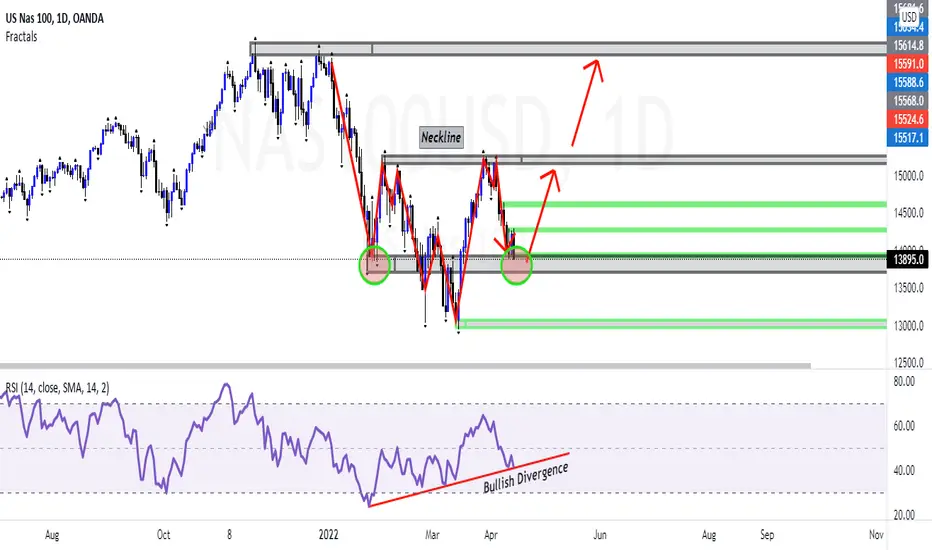
Monthly has large wicks rejecting 14000 price area. 2 months back-to-back. Monthly Bullish Engulfing as well.
Weekly candle stick analysis could be a double bottom forming or a higher low. Due to Daily analysis expecting this to be a weekly higher low.
Daily has created an inverse head & shoulder pattern with bullish divergence.
If price rejects this zone and breaks structure for turnaround of buys. Expecting price to continue pattern to upside near 15600 long term.

Thông báo miễn trừ trách nhiệm
Thông tin và các ấn phẩm này không nhằm mục đích, và không cấu thành, lời khuyên hoặc khuyến nghị về tài chính, đầu tư, giao dịch hay các loại khác do TradingView cung cấp hoặc xác nhận. Đọc thêm tại Điều khoản Sử dụng.
Thông báo miễn trừ trách nhiệm
Thông tin và các ấn phẩm này không nhằm mục đích, và không cấu thành, lời khuyên hoặc khuyến nghị về tài chính, đầu tư, giao dịch hay các loại khác do TradingView cung cấp hoặc xác nhận. Đọc thêm tại Điều khoản Sử dụng.