
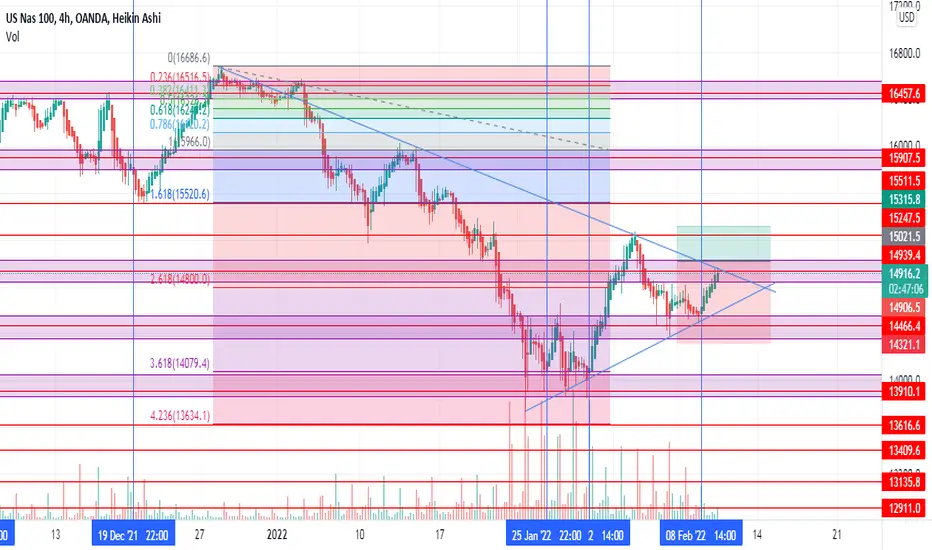
On the Daily timeframe we see a clear downtrend. It touches the trendline more than 5 times, indicating the correct direction of the market. If the market breaks the trendline it should head to the 15072.9 area. On the 4H we see some price action in the key area or golden area, the 618 on the Fibonacci retracement. If it does not break the trendline, it should come down to 14649.3 whhere it should bounce off the trendline and go up.

Thông báo miễn trừ trách nhiệm
Thông tin và các ấn phẩm này không nhằm mục đích, và không cấu thành, lời khuyên hoặc khuyến nghị về tài chính, đầu tư, giao dịch hay các loại khác do TradingView cung cấp hoặc xác nhận. Đọc thêm tại Điều khoản Sử dụng.
Thông báo miễn trừ trách nhiệm
Thông tin và các ấn phẩm này không nhằm mục đích, và không cấu thành, lời khuyên hoặc khuyến nghị về tài chính, đầu tư, giao dịch hay các loại khác do TradingView cung cấp hoặc xác nhận. Đọc thêm tại Điều khoản Sử dụng.