
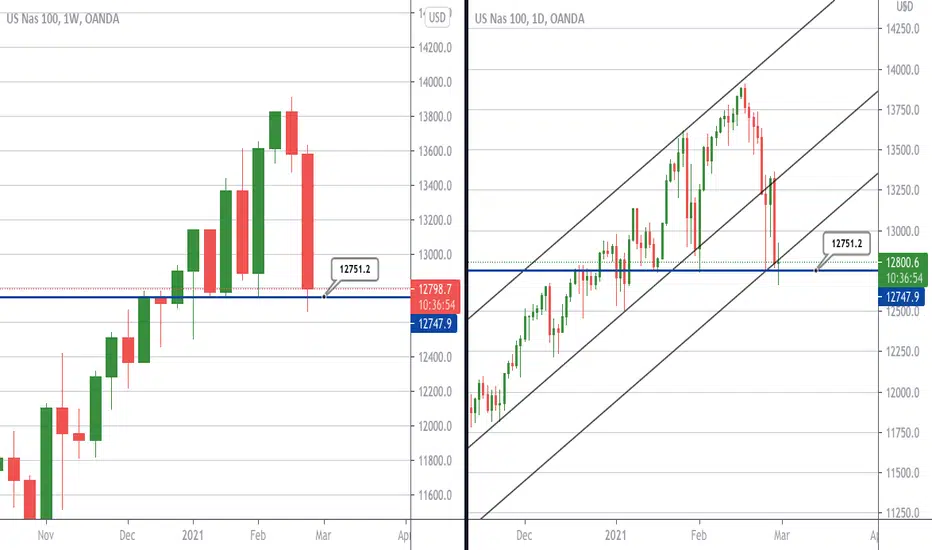
Nasdaq analysis Daily/Weekly TF
Nasdaq is back at this very crucial point. where the price has come many times this year but failed to break. Will it break this time? You can see on the left hand side the weekly timeframe how many times it has come and touched or attempted to break but failed everytime. On the right hand side we have the daily timeframe we can see it is still a overall bullish trend. a failed break can probably make this bullish trend continue maybe taking us to new highs. One thing for sure when it moves it will move fast.
Nasdaq is back at this very crucial point. where the price has come many times this year but failed to break. Will it break this time? You can see on the left hand side the weekly timeframe how many times it has come and touched or attempted to break but failed everytime. On the right hand side we have the daily timeframe we can see it is still a overall bullish trend. a failed break can probably make this bullish trend continue maybe taking us to new highs. One thing for sure when it moves it will move fast.

Thông báo miễn trừ trách nhiệm
Thông tin và các ấn phẩm này không nhằm mục đích, và không cấu thành, lời khuyên hoặc khuyến nghị về tài chính, đầu tư, giao dịch hay các loại khác do TradingView cung cấp hoặc xác nhận. Đọc thêm tại Điều khoản Sử dụng.
Thông báo miễn trừ trách nhiệm
Thông tin và các ấn phẩm này không nhằm mục đích, và không cấu thành, lời khuyên hoặc khuyến nghị về tài chính, đầu tư, giao dịch hay các loại khác do TradingView cung cấp hoặc xác nhận. Đọc thêm tại Điều khoản Sử dụng.