
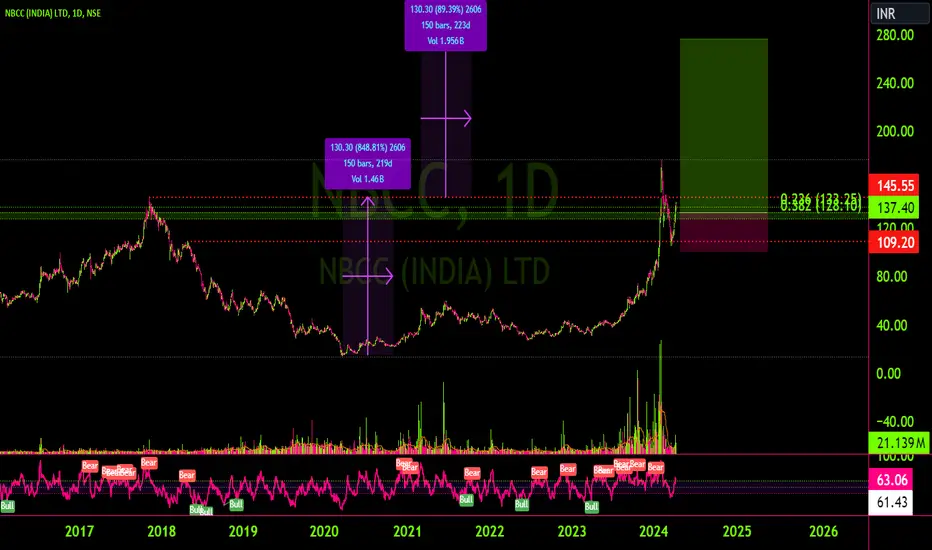
NBCC has formed a CUP chart pattern and traded near neckline level 146.
The volume is increasing as the price is nearing the neckline level. It tried to break the neckline before, but it was a fake breakout or was not sustained.
The monthly RSI is over 78, the weekly RSI is almost 64, taking support at 60, and the daily RSI crosses 60 from below.
If you measure the depth of the cup and clone it over the neckline, that would be your target, and the previous higher low would be your stop loss. If the trade goes as described, it would give you a risk-to-reward ratio over 3.
The volume is increasing as the price is nearing the neckline level. It tried to break the neckline before, but it was a fake breakout or was not sustained.
The monthly RSI is over 78, the weekly RSI is almost 64, taking support at 60, and the daily RSI crosses 60 from below.
If you measure the depth of the cup and clone it over the neckline, that would be your target, and the previous higher low would be your stop loss. If the trade goes as described, it would give you a risk-to-reward ratio over 3.

Thông báo miễn trừ trách nhiệm
Thông tin và các ấn phẩm này không nhằm mục đích, và không cấu thành, lời khuyên hoặc khuyến nghị về tài chính, đầu tư, giao dịch hay các loại khác do TradingView cung cấp hoặc xác nhận. Đọc thêm tại Điều khoản Sử dụng.
Thông báo miễn trừ trách nhiệm
Thông tin và các ấn phẩm này không nhằm mục đích, và không cấu thành, lời khuyên hoặc khuyến nghị về tài chính, đầu tư, giao dịch hay các loại khác do TradingView cung cấp hoặc xác nhận. Đọc thêm tại Điều khoản Sử dụng.