
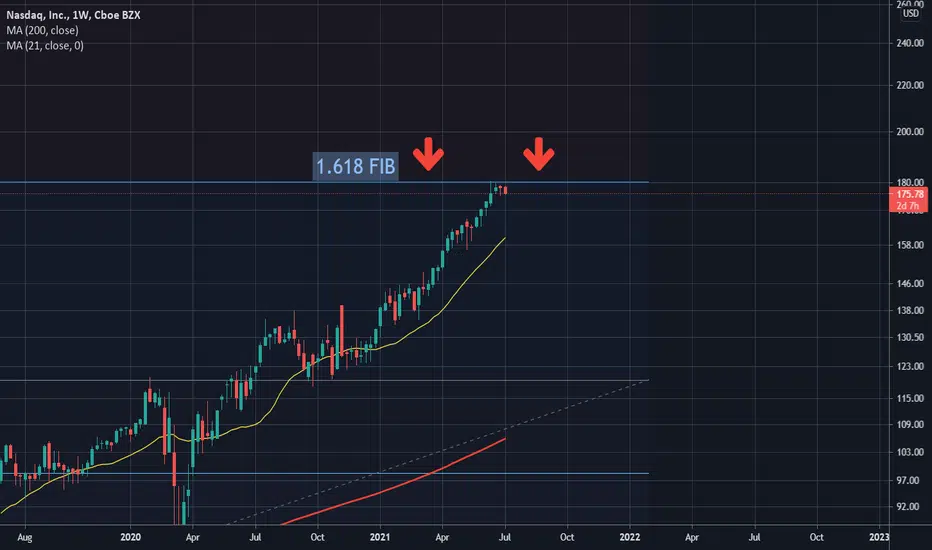
The weekly chart of the Nasdaq index is showing weakness with multiple weekly candle rejections at exactly the 1.618 fibonacci extension level.
This is key to note as the 1.618 as many know is often the first place traders short, sell and or take profits after price breaks all time high. So paying attention to the $180 level will be important. If bulls can ever get a weekly close above this level, the run up can continue.
Until then, proceed with caution this week and probably the next if your portfolio is very tech stock heavy.
This is key to note as the 1.618 as many know is often the first place traders short, sell and or take profits after price breaks all time high. So paying attention to the $180 level will be important. If bulls can ever get a weekly close above this level, the run up can continue.
Until then, proceed with caution this week and probably the next if your portfolio is very tech stock heavy.

Bài đăng liên quan
Thông báo miễn trừ trách nhiệm
Thông tin và các ấn phẩm này không nhằm mục đích, và không cấu thành, lời khuyên hoặc khuyến nghị về tài chính, đầu tư, giao dịch hay các loại khác do TradingView cung cấp hoặc xác nhận. Đọc thêm tại Điều khoản Sử dụng.
Bài đăng liên quan
Thông báo miễn trừ trách nhiệm
Thông tin và các ấn phẩm này không nhằm mục đích, và không cấu thành, lời khuyên hoặc khuyến nghị về tài chính, đầu tư, giao dịch hay các loại khác do TradingView cung cấp hoặc xác nhận. Đọc thêm tại Điều khoản Sử dụng.