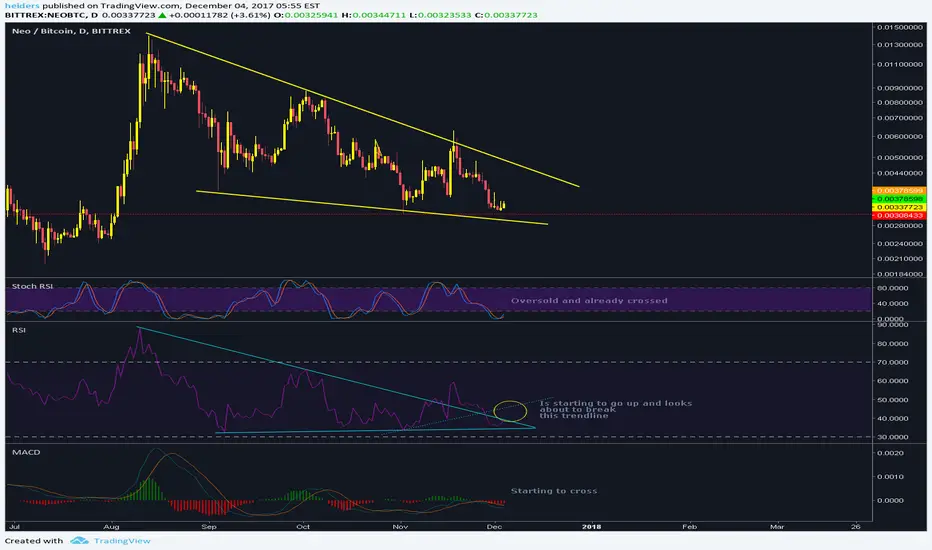
NEO has been in a downtrend since mid August. After a failed swing that could not break the upper trendline and a deep retracement, the indicators again show a positive future for NEO. The Stochastic RSI shows that NEO is oversold on the daily chart has already crossed. Similarly, the RSI is also going up again and seems to be breaking a long term trendline on this chart. It did so as well on the previous swing, but failed to continue at that point and returned in the channel. The MACD seems ready to cross and turn green also. So it looks lik eeverything is lining up again for a nice move up. But NEO is quite fickle and can't always be predicted so easily, so we will have to see. I have added some o my position here and will buy more only after a confirmation of a good move upwards.
Giao dịch đang hoạt động
Worked out very well so far. NEO seems to be in this continuation pattern at the moment, which looks pretty bullish. 
Bài đăng liên quan
Thông báo miễn trừ trách nhiệm
Thông tin và các ấn phẩm này không nhằm mục đích, và không cấu thành, lời khuyên hoặc khuyến nghị về tài chính, đầu tư, giao dịch hay các loại khác do TradingView cung cấp hoặc xác nhận. Đọc thêm tại Điều khoản Sử dụng.
Bài đăng liên quan
Thông báo miễn trừ trách nhiệm
Thông tin và các ấn phẩm này không nhằm mục đích, và không cấu thành, lời khuyên hoặc khuyến nghị về tài chính, đầu tư, giao dịch hay các loại khác do TradingView cung cấp hoặc xác nhận. Đọc thêm tại Điều khoản Sử dụng.