
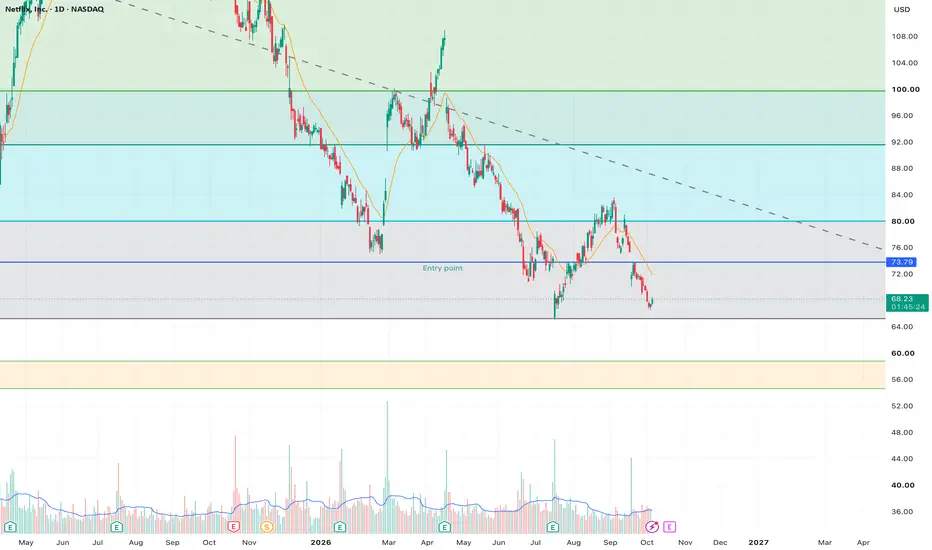
Why -
The business is intact. Q2 revenue was $12.56B (+13%) with a 33.4% operating margin, free cash flow is guided to about $12.5B for the year, and ad revenue is on track to roughly double to about $3B.
The selloff is about sentiment and engagement fears (YouTube share, a thin originals slate), not collapsing numbers. The stock is down about 25% this year and trades near 21x trailing earnings.
It is stretched to the downside. Daily RSI is about 32.
Levels (daily chart)
Support: $65, near the 52-week low of $65.08.
Buy zone if $65 fails: $55-58.
Upside targets: $72-74 (resistance cluster), then about $76 (50-day average), about $83 (200-day average), and about $94 (analyst average target).
Stop-loss: $40 on a weekly close (weekly chart).
Plan
1. $65 holds on the daily: a bounce toward $72-76 is the first leg.
2. Daily close below $65: don't chase. Wait for $55-58 and scale in.
3. Weekly close below $40: thesis invalid, exit.
Events to watch
Q3 earnings, Oct 20 (after close): consensus EPS is $0.82, up 39% year on year. Watch revenue against the $12.86B guide, the Q4 outlook, ad revenue and any engagement commentary.
Monthly Nielsen Gauge data on YouTube vs Netflix viewing share.
Analyst rating and target changes after earnings.
Risks: Earnings can gap through any level, and beta is about 1.5. A continued engagement decline would undercut the thesis.
The main idea here works best as, accumulate at the weakness.
Thank you.
Happy Investing :)
Note - This is a manual research report using AI platform, for getting an extensive data to analyse the stock.
The business is intact. Q2 revenue was $12.56B (+13%) with a 33.4% operating margin, free cash flow is guided to about $12.5B for the year, and ad revenue is on track to roughly double to about $3B.
The selloff is about sentiment and engagement fears (YouTube share, a thin originals slate), not collapsing numbers. The stock is down about 25% this year and trades near 21x trailing earnings.
It is stretched to the downside. Daily RSI is about 32.
Levels (daily chart)
Support: $65, near the 52-week low of $65.08.
Buy zone if $65 fails: $55-58.
Upside targets: $72-74 (resistance cluster), then about $76 (50-day average), about $83 (200-day average), and about $94 (analyst average target).
Stop-loss: $40 on a weekly close (weekly chart).
Plan
1. $65 holds on the daily: a bounce toward $72-76 is the first leg.
2. Daily close below $65: don't chase. Wait for $55-58 and scale in.
3. Weekly close below $40: thesis invalid, exit.
Events to watch
Q3 earnings, Oct 20 (after close): consensus EPS is $0.82, up 39% year on year. Watch revenue against the $12.86B guide, the Q4 outlook, ad revenue and any engagement commentary.
Monthly Nielsen Gauge data on YouTube vs Netflix viewing share.
Analyst rating and target changes after earnings.
Risks: Earnings can gap through any level, and beta is about 1.5. A continued engagement decline would undercut the thesis.
The main idea here works best as, accumulate at the weakness.
Thank you.
Happy Investing :)
Note - This is a manual research report using AI platform, for getting an extensive data to analyse the stock.

Thông báo miễn trừ trách nhiệm
Thông tin và các ấn phẩm này không nhằm mục đích, và không cấu thành, lời khuyên hoặc khuyến nghị về tài chính, đầu tư, giao dịch hay các loại khác do TradingView cung cấp hoặc xác nhận. Đọc thêm tại Điều khoản Sử dụng.
Thông báo miễn trừ trách nhiệm
Thông tin và các ấn phẩm này không nhằm mục đích, và không cấu thành, lời khuyên hoặc khuyến nghị về tài chính, đầu tư, giao dịch hay các loại khác do TradingView cung cấp hoặc xác nhận. Đọc thêm tại Điều khoản Sử dụng.