
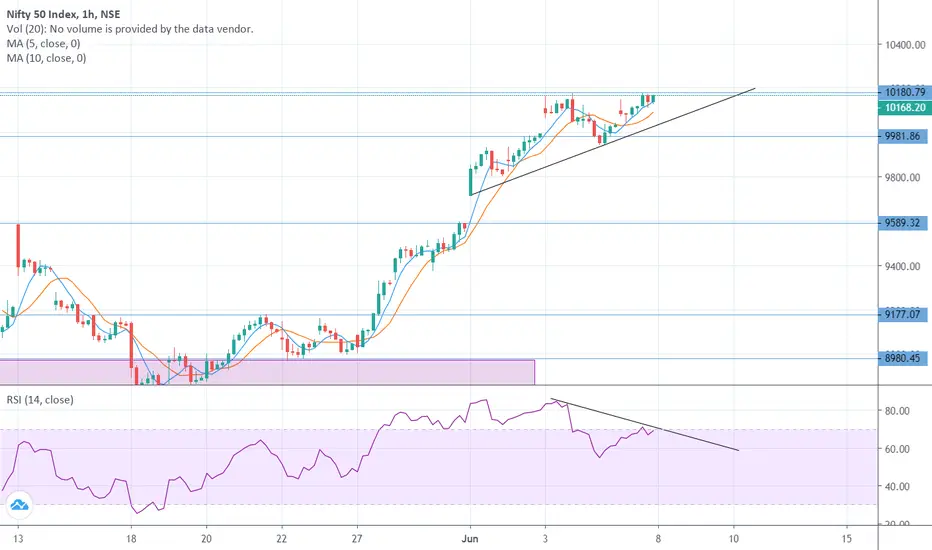
From the hourly chart of Nifty 50, we can clearly see it is making double top pattern, which is a indication of trend reversal. Also, RSI is showing negative divergence which implies that the Nifty can slide down. Nifty is at strong resistance level. We have to keep checking how it behaves on Monday, and with the confirmation of trend reversal we can short for good profits.
Shorting after the trend line (shown in image) breaks will be a good opportunity. Keep an eye on it on Monday 8th of June 2020.
Shorting after the trend line (shown in image) breaks will be a good opportunity. Keep an eye on it on Monday 8th of June 2020.
Ghi chú
Also, Nifty can make Double top pattern.
Thông báo miễn trừ trách nhiệm
Thông tin và các ấn phẩm này không nhằm mục đích, và không cấu thành, lời khuyên hoặc khuyến nghị về tài chính, đầu tư, giao dịch hay các loại khác do TradingView cung cấp hoặc xác nhận. Đọc thêm tại Điều khoản Sử dụng.
Thông báo miễn trừ trách nhiệm
Thông tin và các ấn phẩm này không nhằm mục đích, và không cấu thành, lời khuyên hoặc khuyến nghị về tài chính, đầu tư, giao dịch hay các loại khác do TradingView cung cấp hoặc xác nhận. Đọc thêm tại Điều khoản Sử dụng.