
NIFTY 50 is India's benchmark stock market index, tracking the performance of 50 of the country's largest and most actively traded companies across a wide range of sectors. It is widely used as a barometer of the overall Indian equity market.
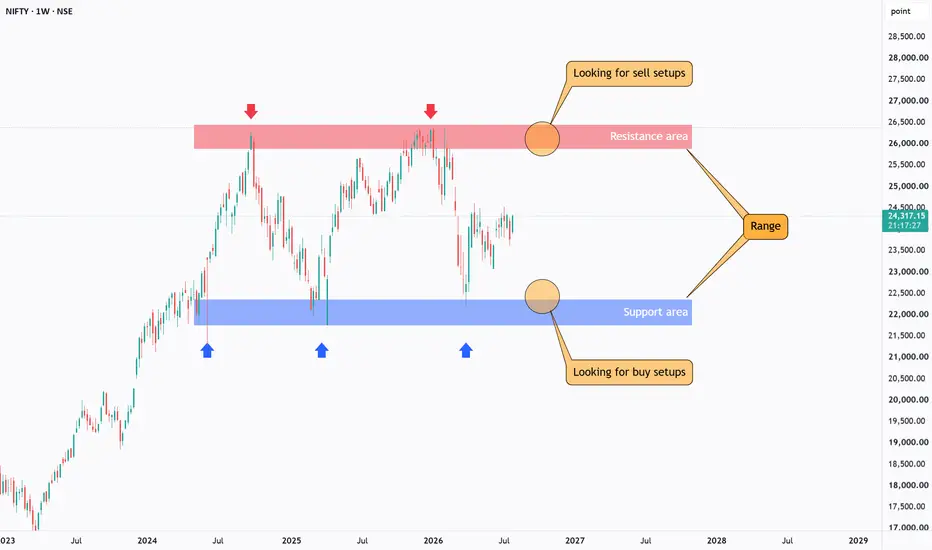
From a technical perspective, NIFTY has been trading between the red resistance area and the blue support zone for an extended period, with neither buyers nor sellers able to establish a clear directional trend.
Price is currently trading near the middle of this range, offering limited trading opportunities at current levels. The more attractive setups are likely to appear as price approaches either boundary of the range.
⭕As price approaches the red resistance area, we can start looking for sell setups on lower timeframes, while the blue support zone may provide opportunities to look for buy setups as price moves closer to it.
⭕The current range is likely to remain intact until price breaks one of its boundaries. A break above the red resistance would strengthen the bullish scenario, while a break below the blue support would increase the probability of a bearish move.
The next breakout may reveal whether buyers or sellers are finally ready to take control after this extended period of consolidation.
⚠️Disclaimer: This analysis reflects my personal market view and is not financial advice.
Rayan Nasser
#NIFTY #NIFTY50 #India #Indices #TechnicalAnalysis #PriceAction #Trading #MarketStructure
From a technical perspective, NIFTY has been trading between the red resistance area and the blue support zone for an extended period, with neither buyers nor sellers able to establish a clear directional trend.
Price is currently trading near the middle of this range, offering limited trading opportunities at current levels. The more attractive setups are likely to appear as price approaches either boundary of the range.
⭕As price approaches the red resistance area, we can start looking for sell setups on lower timeframes, while the blue support zone may provide opportunities to look for buy setups as price moves closer to it.
⭕The current range is likely to remain intact until price breaks one of its boundaries. A break above the red resistance would strengthen the bullish scenario, while a break below the blue support would increase the probability of a bearish move.
The next breakout may reveal whether buyers or sellers are finally ready to take control after this extended period of consolidation.
⚠️Disclaimer: This analysis reflects my personal market view and is not financial advice.
Rayan Nasser
#NIFTY #NIFTY50 #India #Indices #TechnicalAnalysis #PriceAction #Trading #MarketStructure

Thông báo miễn trừ trách nhiệm
Thông tin và các ấn phẩm này không nhằm mục đích, và không cấu thành, lời khuyên hoặc khuyến nghị về tài chính, đầu tư, giao dịch hay các loại khác do TradingView cung cấp hoặc xác nhận. Đọc thêm tại Điều khoản Sử dụng.
Thông báo miễn trừ trách nhiệm
Thông tin và các ấn phẩm này không nhằm mục đích, và không cấu thành, lời khuyên hoặc khuyến nghị về tài chính, đầu tư, giao dịch hay các loại khác do TradingView cung cấp hoặc xác nhận. Đọc thêm tại Điều khoản Sử dụng.