
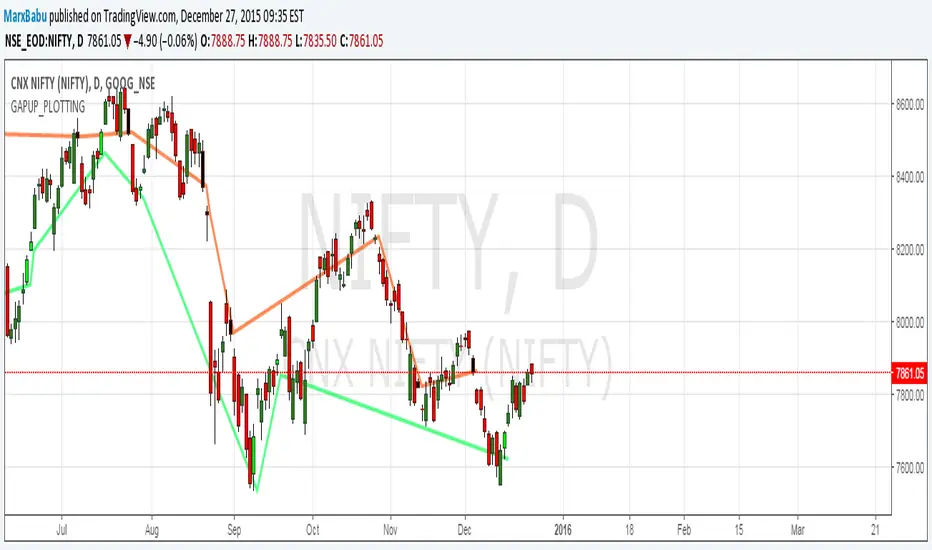
Identify the GAP up and GAP DOWN opening and plot the line.
Strategy when GAPUP identified Buy and target for few 100pips.
1.Color automated Lime candle shows one ahead candle of gapup
2.Black candle shows gapdown.
3.Line drawn for GapUp,GapDown
Strategy when GAPUP identified Buy and target for few 100pips.
1.Color automated Lime candle shows one ahead candle of gapup
2.Black candle shows gapdown.
3.Line drawn for GapUp,GapDown
Ghi chú
The code is available here//version=2
//Author MarxBabu
study(title="GAPUP_PLOTTING", overlay = true)
isUp() => close > open
isDown() => close <= open
//GAP UP DECISION
isGapUp()=> low>low[1] and low>open[1] and low >high[1] and low >close[1] and isUp()
isGapDown()=>high<low[1] and high<open[1] and high< close[1] and high<high[1] and isDown()
x = if isGapUp()
currentLowValue =low[1]
y = if isGapDown()
currentLowValue =close[1]
plot(x, style=line, linewidth=3, color=lime)
plot(y, style=line, linewidth=3, color=red)
barcolor(isGapUp()? #00FF00 :na,-1)
barcolor(isGapDown() ? #030303 :na,-1)

🌳Indicator:bit.ly/2DJVXDn 💚
🦄telegram:t.me/longbuylongsellindicator 🟢
✔️contact:t.me/wealthworldmajic
🎯web:marxcbabu.blogspot.com/
🟠twitter:twitter.com/marxcbabu 💲
youtube.com/@marxcbabu/videos
🦄telegram:t.me/longbuylongsellindicator 🟢
✔️contact:t.me/wealthworldmajic
🎯web:marxcbabu.blogspot.com/
🟠twitter:twitter.com/marxcbabu 💲
youtube.com/@marxcbabu/videos
Thông báo miễn trừ trách nhiệm
Thông tin và các ấn phẩm này không nhằm mục đích, và không cấu thành, lời khuyên hoặc khuyến nghị về tài chính, đầu tư, giao dịch hay các loại khác do TradingView cung cấp hoặc xác nhận. Đọc thêm tại Điều khoản Sử dụng.
🌳Indicator:bit.ly/2DJVXDn 💚
🦄telegram:t.me/longbuylongsellindicator 🟢
✔️contact:t.me/wealthworldmajic
🎯web:marxcbabu.blogspot.com/
🟠twitter:twitter.com/marxcbabu 💲
youtube.com/@marxcbabu/videos
🦄telegram:t.me/longbuylongsellindicator 🟢
✔️contact:t.me/wealthworldmajic
🎯web:marxcbabu.blogspot.com/
🟠twitter:twitter.com/marxcbabu 💲
youtube.com/@marxcbabu/videos
Thông báo miễn trừ trách nhiệm
Thông tin và các ấn phẩm này không nhằm mục đích, và không cấu thành, lời khuyên hoặc khuyến nghị về tài chính, đầu tư, giao dịch hay các loại khác do TradingView cung cấp hoặc xác nhận. Đọc thêm tại Điều khoản Sử dụng.