
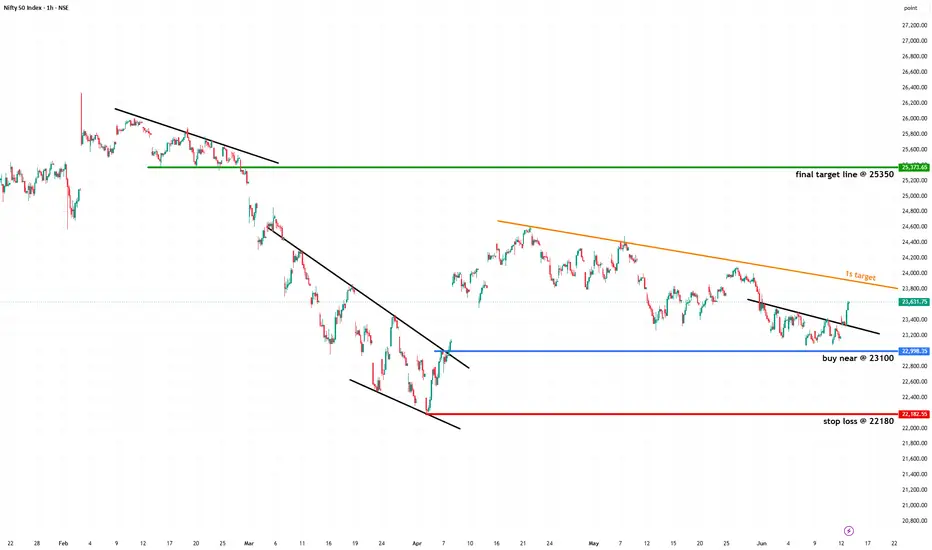
After undergoing a sharp correction from the 26,000+ zone, NIFTY appears to be transitioning from a bearish phase into a potential accumulation and recovery phase. The current chart structure reveals a combination of support confirmation, trendline breakout, and improving price action that could drive the index toward higher resistance levels over the coming weeks.
Market Structure Analysis
The broader trend can be divided into three distinct phases:
Phase 1: Distribution and Breakdown
The first section of the chart shows NIFTY struggling beneath a descending resistance trendline after making its swing highs near the 26,000 region.
Despite multiple attempts by buyers to regain momentum, every rally was sold into, resulting in:
• Lower highs formation
• Weakening bullish momentum
• Breakdown below the major support zone near 25,350
The eventual breakdown of the 25,350 support triggered a significant wave of selling pressure, accelerating the correction.
Phase 2: Capitulation and Bottom Formation
Following the breakdown, NIFTY entered a strong bearish leg and declined toward the 22,000–22,200 zone.
Several important observations emerged during this phase:
✓ Panic selling exhausted near 22,180
✓ A falling wedge structure developed
✓ Price stopped making aggressive new lows
✓ Buyers began defending lower levels
The falling wedge breakout marked the first sign that bearish momentum was fading and that a potential medium-term bottom was forming.
This breakout initiated a recovery rally of nearly 2,000 points from the lows.
Phase 3: Consolidation and Re-Accumulation
Rather than continuing straight upward, NIFTY entered a healthy consolidation phase.
Over the past several weeks, price has been trading within a contracting structure characterized by:
• Higher lows from support zones
• Controlled pullbacks
• Reduced downside momentum
• Compression beneath resistance
The most recent descending trendline has acted as short-term resistance, but price has now started breaking above this structure.
This breakout is important because it suggests that buyers are once again gaining control after weeks of sideways consolidation.
Key Technical Levels
Major Support Zone
23,100 Area
This level has repeatedly acted as a demand zone.
Reasons this support is important:
• Multiple price rejections
• Previous swing lows
• Strong buyer participation
• Psychological support region
As long as NIFTY remains above 23,100, the bullish thesis remains valid.
Risk Management Level
Stop Loss: 22,180
This level represents:
• The swing low of the larger structure
• The base of the falling wedge breakout
• The point where the current bullish setup becomes invalid
A breakdown below 22,180 would indicate that buyers have lost control and the market may revisit lower levels.
Target 1: Descending Trendline Resistance
23,800–24,000 Zone
This area coincides with:
• Long-term falling trendline resistance
• Previous supply zone
• Historical reaction area
Price may experience temporary rejection here, making it a suitable region for partial profit booking.
Final Target: 25,350
The major upside objective remains 25,350.
This level is significant because:
• It previously acted as a major support zone
• Support often becomes resistance after breakdowns
• It aligns with the larger market structure
• It represents the next major hurdle for bulls
If NIFTY sustains above trendline resistance and market sentiment remains positive, a move toward 25,350 becomes increasingly probable.
Why This Trade Has a Favorable Risk-Reward
The setup offers a compelling positional opportunity because:
✅ Buying near support reduces downside risk
✅ Stop loss is clearly defined
✅ Trendline breakout provides confirmation
✅ Multiple bullish structures are visible
✅ Potential reward significantly exceeds risk
The risk-to-reward ratio improves further for traders who accumulate on pullbacks toward the support region instead of chasing price after breakout candles.
Bullish Confirmation Signals to Watch
To strengthen the bullish case, traders should monitor:
• Daily closes above the recent breakout level
• Increasing volume during upward moves
• Higher highs and higher lows formation
• Breakout above the orange resistance trendline
• Sustained trading above 23,500
These developments would increase the probability of an eventual move toward 25,350.
Bearish Scenario
While the setup remains constructive, traders should remain objective.
The bullish outlook would weaken if:
❌ Price falls back below 23,100
❌ Breakout turns into a false breakout
❌ NIFTY closes below 22,180
Such developments would invalidate the current setup and suggest further consolidation or downside risk.
Trade Plan Summary
Entry Zone: 23,100–23,400
Stop Loss: 22,180
Target 1: 23,800–24,000
Final Target: 25,350
View: Positional Bullish Above 23,100
Conclusion
NIFTY appears to be transitioning from a corrective phase into a recovery phase. The combination of a completed falling wedge reversal, strong support near 23,100, and a fresh breakout from short-term descending resistance provides a constructive setup for positional longs. If bulls manage to sustain momentum and clear the overhead trendline resistance, the path toward 25,350 could open over the coming weeks.
Trade safe, follow your risk management, and let price confirm the thesis.
Market Structure Analysis
The broader trend can be divided into three distinct phases:
Phase 1: Distribution and Breakdown
The first section of the chart shows NIFTY struggling beneath a descending resistance trendline after making its swing highs near the 26,000 region.
Despite multiple attempts by buyers to regain momentum, every rally was sold into, resulting in:
• Lower highs formation
• Weakening bullish momentum
• Breakdown below the major support zone near 25,350
The eventual breakdown of the 25,350 support triggered a significant wave of selling pressure, accelerating the correction.
Phase 2: Capitulation and Bottom Formation
Following the breakdown, NIFTY entered a strong bearish leg and declined toward the 22,000–22,200 zone.
Several important observations emerged during this phase:
✓ Panic selling exhausted near 22,180
✓ A falling wedge structure developed
✓ Price stopped making aggressive new lows
✓ Buyers began defending lower levels
The falling wedge breakout marked the first sign that bearish momentum was fading and that a potential medium-term bottom was forming.
This breakout initiated a recovery rally of nearly 2,000 points from the lows.
Phase 3: Consolidation and Re-Accumulation
Rather than continuing straight upward, NIFTY entered a healthy consolidation phase.
Over the past several weeks, price has been trading within a contracting structure characterized by:
• Higher lows from support zones
• Controlled pullbacks
• Reduced downside momentum
• Compression beneath resistance
The most recent descending trendline has acted as short-term resistance, but price has now started breaking above this structure.
This breakout is important because it suggests that buyers are once again gaining control after weeks of sideways consolidation.
Key Technical Levels
Major Support Zone
23,100 Area
This level has repeatedly acted as a demand zone.
Reasons this support is important:
• Multiple price rejections
• Previous swing lows
• Strong buyer participation
• Psychological support region
As long as NIFTY remains above 23,100, the bullish thesis remains valid.
Risk Management Level
Stop Loss: 22,180
This level represents:
• The swing low of the larger structure
• The base of the falling wedge breakout
• The point where the current bullish setup becomes invalid
A breakdown below 22,180 would indicate that buyers have lost control and the market may revisit lower levels.
Target 1: Descending Trendline Resistance
23,800–24,000 Zone
This area coincides with:
• Long-term falling trendline resistance
• Previous supply zone
• Historical reaction area
Price may experience temporary rejection here, making it a suitable region for partial profit booking.
Final Target: 25,350
The major upside objective remains 25,350.
This level is significant because:
• It previously acted as a major support zone
• Support often becomes resistance after breakdowns
• It aligns with the larger market structure
• It represents the next major hurdle for bulls
If NIFTY sustains above trendline resistance and market sentiment remains positive, a move toward 25,350 becomes increasingly probable.
Why This Trade Has a Favorable Risk-Reward
The setup offers a compelling positional opportunity because:
✅ Buying near support reduces downside risk
✅ Stop loss is clearly defined
✅ Trendline breakout provides confirmation
✅ Multiple bullish structures are visible
✅ Potential reward significantly exceeds risk
The risk-to-reward ratio improves further for traders who accumulate on pullbacks toward the support region instead of chasing price after breakout candles.
Bullish Confirmation Signals to Watch
To strengthen the bullish case, traders should monitor:
• Daily closes above the recent breakout level
• Increasing volume during upward moves
• Higher highs and higher lows formation
• Breakout above the orange resistance trendline
• Sustained trading above 23,500
These developments would increase the probability of an eventual move toward 25,350.
Bearish Scenario
While the setup remains constructive, traders should remain objective.
The bullish outlook would weaken if:
❌ Price falls back below 23,100
❌ Breakout turns into a false breakout
❌ NIFTY closes below 22,180
Such developments would invalidate the current setup and suggest further consolidation or downside risk.
Trade Plan Summary
Entry Zone: 23,100–23,400
Stop Loss: 22,180
Target 1: 23,800–24,000
Final Target: 25,350
View: Positional Bullish Above 23,100
Conclusion
NIFTY appears to be transitioning from a corrective phase into a recovery phase. The combination of a completed falling wedge reversal, strong support near 23,100, and a fresh breakout from short-term descending resistance provides a constructive setup for positional longs. If bulls manage to sustain momentum and clear the overhead trendline resistance, the path toward 25,350 could open over the coming weeks.
Trade safe, follow your risk management, and let price confirm the thesis.
Giao dịch đang hoạt động
15 minute setup
Ghi chú
15 minute another setup
Ghi chú
1st target successfully achieved Ghi chú
around 600 point profit currently after posting this chart Ghi chú
its a ideal place to buy when hourly rsi below 30 in this setup and hourly close greater than previous hourly close , stop below 23775 (stop loss hourly closing basis )Ghi chú
around 1100 point profit running Đóng lệnh: đạt mục tiêu

Bài đăng liên quan
Thông báo miễn trừ trách nhiệm
Thông tin và các ấn phẩm này không nhằm mục đích, và không cấu thành, lời khuyên hoặc khuyến nghị về tài chính, đầu tư, giao dịch hay các loại khác do TradingView cung cấp hoặc xác nhận. Đọc thêm tại Điều khoản Sử dụng.
Bài đăng liên quan
Thông báo miễn trừ trách nhiệm
Thông tin và các ấn phẩm này không nhằm mục đích, và không cấu thành, lời khuyên hoặc khuyến nghị về tài chính, đầu tư, giao dịch hay các loại khác do TradingView cung cấp hoặc xác nhận. Đọc thêm tại Điều khoản Sử dụng.