
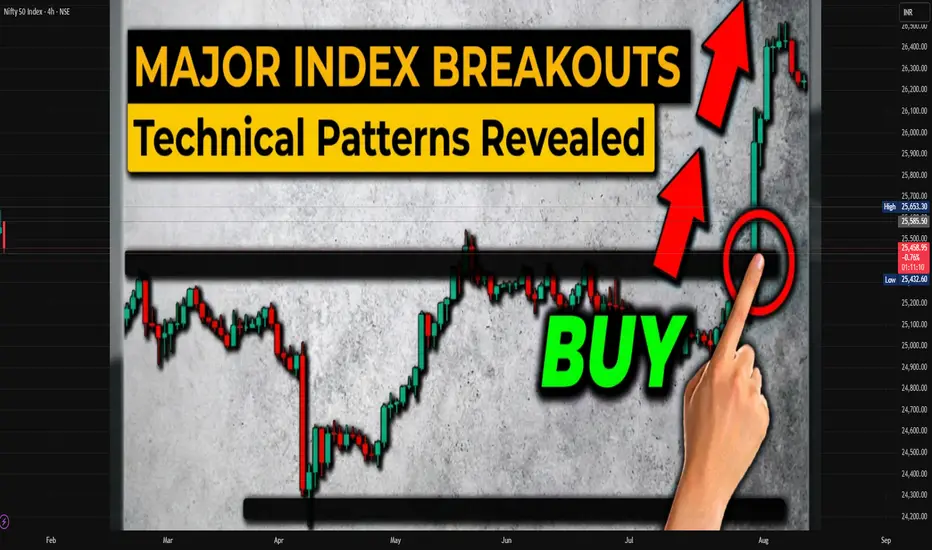
1. Introduction to Technical Pattern Breakouts
Technical pattern breakouts occur when the price of an index moves decisively beyond a well-defined support or resistance level formed by a chart pattern. In major indexes such as the NIFTY 50, Bank NIFTY, Sensex, S&P 500, NASDAQ, Dow Jones, FTSE 100, and Nikkei 225, breakouts are closely watched because they often signal a shift in market sentiment, trend continuation, or the start of a new trend. Since indexes represent a basket of stocks, breakouts in them tend to be more reliable than in individual stocks due to reduced manipulation and broader participation.
Breakouts are widely used by swing traders, positional traders, and long-term investors to identify high-probability opportunities with favorable risk-reward ratios.
2. Why Breakouts in Major Indexes Matter
Breakouts in indexes carry greater significance than single-stock breakouts for several reasons:
Market-wide confirmation: Index breakouts indicate broad participation across sectors.
Institutional involvement: Large funds and institutions primarily trade index futures, ETFs, and options.
Trend leadership: Index direction often dictates individual stock trends.
Volatility expansion: Breakouts usually lead to increased volatility, creating trading opportunities.
For example, a breakout in Bank NIFTY often precedes strong moves in banking stocks, while a NASDAQ breakout may signal momentum in technology shares.
3. Common Technical Patterns in Index Charts
a) Horizontal Range / Rectangle Pattern
This pattern forms when an index trades within a defined support and resistance range.
Bullish breakout: Price closes above resistance with strong volume.
Bearish breakdown: Price closes below support.
In major indexes, range breakouts often occur after periods of consolidation during uncertain macro or policy phases.
b) Ascending Triangle
Higher lows with a flat resistance.
Indicates accumulation and bullish bias.
Breakout above resistance often leads to strong upside momentum.
Ascending triangles are commonly seen in NIFTY 50 and S&P 500 during bull markets.
c) Descending Triangle
Lower highs with flat support.
Shows distribution and bearish pressure.
Breakdown below support signals further downside.
This pattern becomes prominent during corrective or bearish phases.
d) Symmetrical Triangle
Converging trendlines with lower highs and higher lows.
Reflects market indecision.
Breakout direction defines the next major move.
Symmetrical triangle breakouts in indexes often align with major news events like central bank decisions or economic data releases.
e) Flag and Pennant Patterns
Short consolidation after a sharp move.
Breakout usually continues in the direction of the prior trend.
Indicates healthy pause rather than reversal.
These patterns are highly effective in strong trending markets.
4. Key Breakout Levels in Major Indexes
Breakout levels in indexes are typically identified using:
Previous all-time highs
Major swing highs or lows
Psychological round numbers (e.g., NIFTY 20,000; S&P 5,000)
Trendline resistance or support
Moving averages (50-DMA, 100-DMA, 200-DMA)
A breakout above a previous all-time high in an index is particularly powerful, as it indicates there is no overhead supply.
5. Role of Volume and Market Breadth
Volume and breadth play a crucial role in validating index breakouts:
Volume expansion: Confirms genuine participation.
Advance-decline ratio: More advancing stocks than declining stocks supports bullish breakouts.
Sector participation: Multiple sectors breaking out together increases reliability.
A breakout without volume or breadth confirmation may result in a false breakout.
6. Indicators Used to Confirm Breakouts
a) Relative Strength Index (RSI)
RSI above 60–65 supports bullish breakouts.
RSI below 40 supports bearish breakdowns.
Divergence may warn of false breakouts.
b) Moving Average Convergence Divergence (MACD)
Bullish crossover near breakout strengthens the signal.
Increasing histogram bars indicate momentum.
c) Average Directional Index (ADX)
ADX above 25 confirms strong trend strength post-breakout.
Helps differentiate between range and trending markets.
7. False Breakouts and How to Avoid Them
False breakouts are common in index trading, especially around news events.
Common reasons for false breakouts:
Low volume
Event-driven spikes
Breakouts during low liquidity sessions
Overextended momentum
Ways to reduce risk:
Wait for daily or weekly close confirmation
Use retest of breakout level strategy
Combine price action with indicators
Avoid trading breakouts just before major announcements
8. Trading Strategies for Index Breakouts
a) Close-Based Breakout Strategy
Enter only after the index closes above resistance or below support on the daily/weekly chart.
b) Pullback or Retest Strategy
After breakout, wait for price to retest the breakout level and then enter in the direction of the trend.
c) Multi-Timeframe Confirmation
Use higher timeframe (weekly) for breakout direction and lower timeframe (hourly or daily) for entry.
d) Options Strategy
Use ATM or slightly ITM options during strong breakouts.
Bull call spreads or bear put spreads reduce risk.
Rising implied volatility often benefits breakout traders.
9. Risk Management in Breakout Trading
Risk management is essential when trading index breakouts:
Stop-loss placement: Below breakout level for bullish trades and above breakdown level for bearish trades.
Position sizing: Limit risk to a fixed percentage of capital.
Trailing stops: Protect profits as the trend extends.
Avoid overtrading: Not every breakout leads to a sustained trend.
Indexes tend to trend well, but sharp reversals can occur during global risk-off events.
10. Long-Term Impact of Index Breakouts
From an investment perspective, long-term breakouts in indexes mark structural shifts in markets. Examples include post-crisis recoveries, liquidity-driven rallies, or technological transformations. Investors often increase equity allocation after confirmed long-term breakouts above major resistance or all-time highs.
11. Conclusion
Technical pattern breakouts in major indexes are among the most reliable signals in technical analysis. They reflect collective market psychology, institutional participation, and macroeconomic alignment. By combining clear chart patterns, volume and breadth analysis, momentum indicators, and disciplined risk management, traders and investors can significantly improve their decision-making.
Technical pattern breakouts occur when the price of an index moves decisively beyond a well-defined support or resistance level formed by a chart pattern. In major indexes such as the NIFTY 50, Bank NIFTY, Sensex, S&P 500, NASDAQ, Dow Jones, FTSE 100, and Nikkei 225, breakouts are closely watched because they often signal a shift in market sentiment, trend continuation, or the start of a new trend. Since indexes represent a basket of stocks, breakouts in them tend to be more reliable than in individual stocks due to reduced manipulation and broader participation.
Breakouts are widely used by swing traders, positional traders, and long-term investors to identify high-probability opportunities with favorable risk-reward ratios.
2. Why Breakouts in Major Indexes Matter
Breakouts in indexes carry greater significance than single-stock breakouts for several reasons:
Market-wide confirmation: Index breakouts indicate broad participation across sectors.
Institutional involvement: Large funds and institutions primarily trade index futures, ETFs, and options.
Trend leadership: Index direction often dictates individual stock trends.
Volatility expansion: Breakouts usually lead to increased volatility, creating trading opportunities.
For example, a breakout in Bank NIFTY often precedes strong moves in banking stocks, while a NASDAQ breakout may signal momentum in technology shares.
3. Common Technical Patterns in Index Charts
a) Horizontal Range / Rectangle Pattern
This pattern forms when an index trades within a defined support and resistance range.
Bullish breakout: Price closes above resistance with strong volume.
Bearish breakdown: Price closes below support.
In major indexes, range breakouts often occur after periods of consolidation during uncertain macro or policy phases.
b) Ascending Triangle
Higher lows with a flat resistance.
Indicates accumulation and bullish bias.
Breakout above resistance often leads to strong upside momentum.
Ascending triangles are commonly seen in NIFTY 50 and S&P 500 during bull markets.
c) Descending Triangle
Lower highs with flat support.
Shows distribution and bearish pressure.
Breakdown below support signals further downside.
This pattern becomes prominent during corrective or bearish phases.
d) Symmetrical Triangle
Converging trendlines with lower highs and higher lows.
Reflects market indecision.
Breakout direction defines the next major move.
Symmetrical triangle breakouts in indexes often align with major news events like central bank decisions or economic data releases.
e) Flag and Pennant Patterns
Short consolidation after a sharp move.
Breakout usually continues in the direction of the prior trend.
Indicates healthy pause rather than reversal.
These patterns are highly effective in strong trending markets.
4. Key Breakout Levels in Major Indexes
Breakout levels in indexes are typically identified using:
Previous all-time highs
Major swing highs or lows
Psychological round numbers (e.g., NIFTY 20,000; S&P 5,000)
Trendline resistance or support
Moving averages (50-DMA, 100-DMA, 200-DMA)
A breakout above a previous all-time high in an index is particularly powerful, as it indicates there is no overhead supply.
5. Role of Volume and Market Breadth
Volume and breadth play a crucial role in validating index breakouts:
Volume expansion: Confirms genuine participation.
Advance-decline ratio: More advancing stocks than declining stocks supports bullish breakouts.
Sector participation: Multiple sectors breaking out together increases reliability.
A breakout without volume or breadth confirmation may result in a false breakout.
6. Indicators Used to Confirm Breakouts
a) Relative Strength Index (RSI)
RSI above 60–65 supports bullish breakouts.
RSI below 40 supports bearish breakdowns.
Divergence may warn of false breakouts.
b) Moving Average Convergence Divergence (MACD)
Bullish crossover near breakout strengthens the signal.
Increasing histogram bars indicate momentum.
c) Average Directional Index (ADX)
ADX above 25 confirms strong trend strength post-breakout.
Helps differentiate between range and trending markets.
7. False Breakouts and How to Avoid Them
False breakouts are common in index trading, especially around news events.
Common reasons for false breakouts:
Low volume
Event-driven spikes
Breakouts during low liquidity sessions
Overextended momentum
Ways to reduce risk:
Wait for daily or weekly close confirmation
Use retest of breakout level strategy
Combine price action with indicators
Avoid trading breakouts just before major announcements
8. Trading Strategies for Index Breakouts
a) Close-Based Breakout Strategy
Enter only after the index closes above resistance or below support on the daily/weekly chart.
b) Pullback or Retest Strategy
After breakout, wait for price to retest the breakout level and then enter in the direction of the trend.
c) Multi-Timeframe Confirmation
Use higher timeframe (weekly) for breakout direction and lower timeframe (hourly or daily) for entry.
d) Options Strategy
Use ATM or slightly ITM options during strong breakouts.
Bull call spreads or bear put spreads reduce risk.
Rising implied volatility often benefits breakout traders.
9. Risk Management in Breakout Trading
Risk management is essential when trading index breakouts:
Stop-loss placement: Below breakout level for bullish trades and above breakdown level for bearish trades.
Position sizing: Limit risk to a fixed percentage of capital.
Trailing stops: Protect profits as the trend extends.
Avoid overtrading: Not every breakout leads to a sustained trend.
Indexes tend to trend well, but sharp reversals can occur during global risk-off events.
10. Long-Term Impact of Index Breakouts
From an investment perspective, long-term breakouts in indexes mark structural shifts in markets. Examples include post-crisis recoveries, liquidity-driven rallies, or technological transformations. Investors often increase equity allocation after confirmed long-term breakouts above major resistance or all-time highs.
11. Conclusion
Technical pattern breakouts in major indexes are among the most reliable signals in technical analysis. They reflect collective market psychology, institutional participation, and macroeconomic alignment. By combining clear chart patterns, volume and breadth analysis, momentum indicators, and disciplined risk management, traders and investors can significantly improve their decision-making.

Bài đăng liên quan
Thông báo miễn trừ trách nhiệm
Thông tin và các ấn phẩm này không nhằm mục đích, và không cấu thành, lời khuyên hoặc khuyến nghị về tài chính, đầu tư, giao dịch hay các loại khác do TradingView cung cấp hoặc xác nhận. Đọc thêm tại Điều khoản Sử dụng.
Bài đăng liên quan
Thông báo miễn trừ trách nhiệm
Thông tin và các ấn phẩm này không nhằm mục đích, và không cấu thành, lời khuyên hoặc khuyến nghị về tài chính, đầu tư, giao dịch hay các loại khác do TradingView cung cấp hoặc xác nhận. Đọc thêm tại Điều khoản Sử dụng.