
Overview
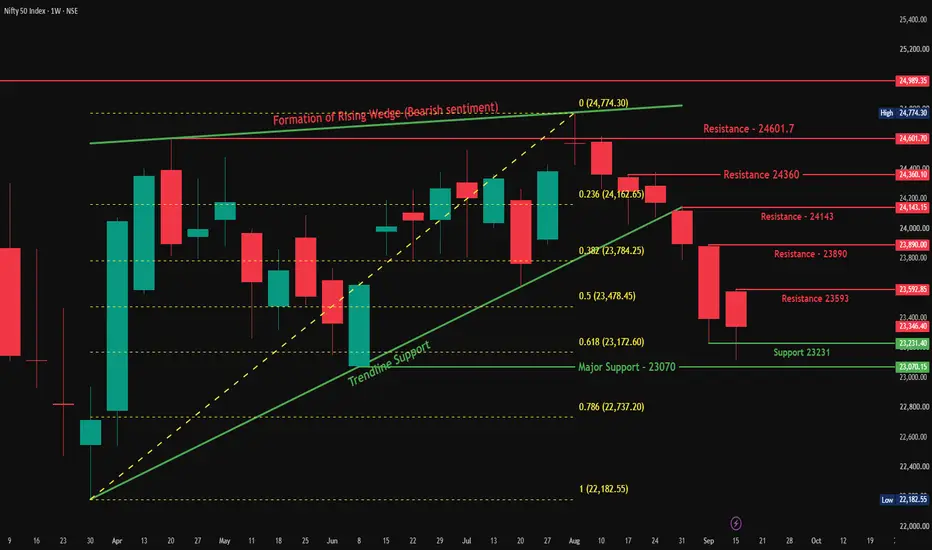
Nifty closed the week at 23,346.40, down 51.70 points or 0.22%, a much smaller decline than recent weeks. Price tested Support 23,231 and held above Major Support (23,070), the confluence zone flagged last week, and has since stabilized within a tight range.
Follow-up on Last Week's View
Last week we flagged the Trendline + 0.618 Fib confluence (23,172) breaking down, with Major Support (23,070) as the next target. That level came close to being tested, with the low landing at 23,116.10, just above Major Support, before buyers stepped in. This week's price action shows the selling pressure easing, with a much smaller weekly decline compared to the prior sharp drops.
Pattern Explanation
Price is now building a small base just above Support 23,231, with a resistance ladder forming overhead: 23,593, then 23,890, then 24,143, and finally the bigger Resistance zone (24,360–24,601.70). Each of these levels will need to be cleared in sequence for the broader downtrend to be meaningfully challenged. The longer-term Rising Wedge breakdown context still applies, so this stabilization needs to be treated as a potential pause rather than a confirmed reversal until more resistance levels are reclaimed.
Key Levels
Resistance Zone: 24,360–24,601.70
Resistance 3: 24,143
Resistance 2: 23,890
Resistance 1: 23,593
Support: 23,231
Major Support: 23,070
Scenarios
Bullish: If Nifty reclaims 23,593 with strength, it would suggest this stabilization is turning into a genuine recovery attempt, opening the path toward 23,890 and 24,143.
Bearish: If Nifty breaks below Support 23,231 and Major Support (23,070), it would confirm the broader downtrend is resuming, with the 0.786 Fib (22,737) as the next level to watch.
Beginner's Lesson
After a sharp decline, a week (or two) of smaller, tighter candles often signals sellers are running out of momentum, at least temporarily. This doesn't automatically mean a trend reversal, it could just be a pause before the next move. The way to tell the difference is watching how price behaves at the first real resistance test, a strong reclaim suggests genuine buying interest, while a weak bounce and quick rejection suggests the pause is just that, a pause.
Conclusion
Nifty is showing early signs of stabilization after a sharp multi-week decline, holding above Major Support and testing a ladder of resistance levels above. A reclaim of 23,593 would be the first sign of a genuine recovery attempt. A break below 23,231 and 23,070 would confirm the downtrend is still in control. This remains a level-to-level market, with the next couple of weeks likely to clarify which scenario is playing out.
This is for educational purposes only and not investment advice. Please do your own research or consult a financial advisor before making any trading decisions.
Nifty closed the week at 23,346.40, down 51.70 points or 0.22%, a much smaller decline than recent weeks. Price tested Support 23,231 and held above Major Support (23,070), the confluence zone flagged last week, and has since stabilized within a tight range.
Follow-up on Last Week's View
Last week we flagged the Trendline + 0.618 Fib confluence (23,172) breaking down, with Major Support (23,070) as the next target. That level came close to being tested, with the low landing at 23,116.10, just above Major Support, before buyers stepped in. This week's price action shows the selling pressure easing, with a much smaller weekly decline compared to the prior sharp drops.
Pattern Explanation
Price is now building a small base just above Support 23,231, with a resistance ladder forming overhead: 23,593, then 23,890, then 24,143, and finally the bigger Resistance zone (24,360–24,601.70). Each of these levels will need to be cleared in sequence for the broader downtrend to be meaningfully challenged. The longer-term Rising Wedge breakdown context still applies, so this stabilization needs to be treated as a potential pause rather than a confirmed reversal until more resistance levels are reclaimed.
Key Levels
Resistance Zone: 24,360–24,601.70
Resistance 3: 24,143
Resistance 2: 23,890
Resistance 1: 23,593
Support: 23,231
Major Support: 23,070
Scenarios
Bullish: If Nifty reclaims 23,593 with strength, it would suggest this stabilization is turning into a genuine recovery attempt, opening the path toward 23,890 and 24,143.
Bearish: If Nifty breaks below Support 23,231 and Major Support (23,070), it would confirm the broader downtrend is resuming, with the 0.786 Fib (22,737) as the next level to watch.
Beginner's Lesson
After a sharp decline, a week (or two) of smaller, tighter candles often signals sellers are running out of momentum, at least temporarily. This doesn't automatically mean a trend reversal, it could just be a pause before the next move. The way to tell the difference is watching how price behaves at the first real resistance test, a strong reclaim suggests genuine buying interest, while a weak bounce and quick rejection suggests the pause is just that, a pause.
Conclusion
Nifty is showing early signs of stabilization after a sharp multi-week decline, holding above Major Support and testing a ladder of resistance levels above. A reclaim of 23,593 would be the first sign of a genuine recovery attempt. A break below 23,231 and 23,070 would confirm the downtrend is still in control. This remains a level-to-level market, with the next couple of weeks likely to clarify which scenario is playing out.
This is for educational purposes only and not investment advice. Please do your own research or consult a financial advisor before making any trading decisions.

📈 HK Trading Community | Market Structure & Indicator Updates
Telegram: t.me/trendstrike1000
Website: quantumedgepro.netlify.app/
Real traders are built through learning,not tip hunting.So Start Learning How the Market Really Works
Telegram: t.me/trendstrike1000
Website: quantumedgepro.netlify.app/
Real traders are built through learning,not tip hunting.So Start Learning How the Market Really Works
Bài đăng liên quan
Thông báo miễn trừ trách nhiệm
Thông tin và các ấn phẩm này không nhằm mục đích, và không cấu thành, lời khuyên hoặc khuyến nghị về tài chính, đầu tư, giao dịch hay các loại khác do TradingView cung cấp hoặc xác nhận. Đọc thêm tại Điều khoản Sử dụng.
📈 HK Trading Community | Market Structure & Indicator Updates
Telegram: t.me/trendstrike1000
Website: quantumedgepro.netlify.app/
Real traders are built through learning,not tip hunting.So Start Learning How the Market Really Works
Telegram: t.me/trendstrike1000
Website: quantumedgepro.netlify.app/
Real traders are built through learning,not tip hunting.So Start Learning How the Market Really Works
Bài đăng liên quan
Thông báo miễn trừ trách nhiệm
Thông tin và các ấn phẩm này không nhằm mục đích, và không cấu thành, lời khuyên hoặc khuyến nghị về tài chính, đầu tư, giao dịch hay các loại khác do TradingView cung cấp hoặc xác nhận. Đọc thêm tại Điều khoản Sử dụng.