
Overview
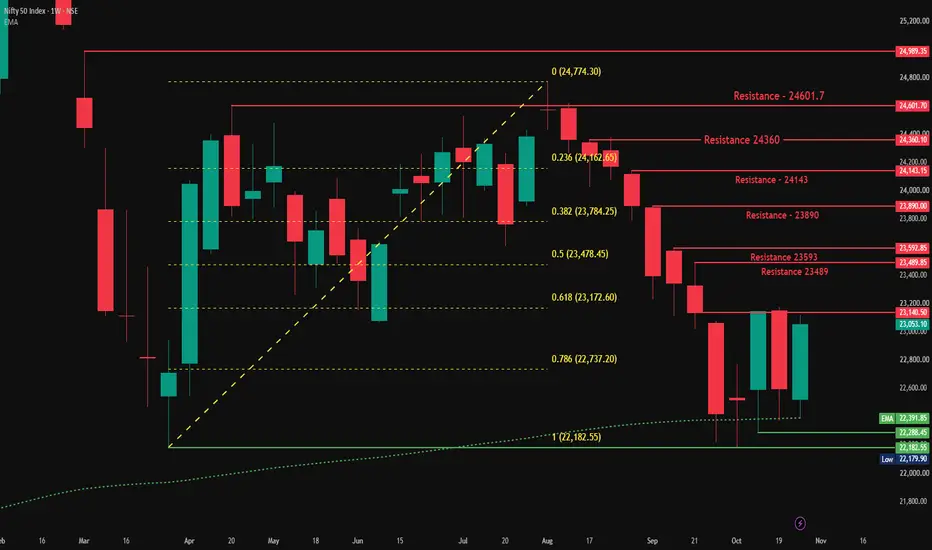
Nifty closed the week at 23,053.10, up 453.10 points or 2.00%. The week started with a dip to 22,387.35, right at the Weekly 200 EMA (22,391.85), and buyers stepped in from there. Price pushed up to a high of 23,118.10 and held most of the gain into the close. That makes the fifth straight week the 22,182-22,391 zone has been defended.
Follow-up on Last Week’s View
Last week we flagged a move above 22,600 opening a path toward 22,735, 22,850, 23,000 and 23,140. Targets 1, 2 and 3 were achieved. Target 4 (23,140) was missed by about 22 points, with the week’s high at 23,118.10. The bearish trigger below 22,182 never came into play.
Pattern Explanation
The weekly lows keep rising: 22,179.90, then 22,288.45, then 22,372.00, and now 22,387.35. Buyers are defending the 200 EMA zone slightly higher each time.
On the upside, the weekly highs have been stuck in a narrow band: 23,149.85, then 23,175.25, and now 23,118.10. That is a flat ceiling, with the 0.618 Fib at 23,172.60 sitting inside it. Rising lows pressing into a flat ceiling is a compression that looks a lot like an ascending triangle. It is still only a setup until price actually breaks out of it.
Key Levels
Resistance 4: 24,143.15
Resistance 3: 23,890
Resistance 2: 23,592.85
Resistance 1: 23,489.85
Ceiling zone: 23,140.50-23,175 (0.618 Fib at 23,172.60)
Bearish trigger: below 22,950
Bearish targets: 22,870, 22,760, 22,670, 22,500
0.786 Fib: 22,737.20
Weekly 200 EMA: 22,391.85
Support: 22,288.45
Major Support / 1.0 Fib: 22,182.55
Psychological Support: 22,000
Scenarios
Bullish: If Nifty moves above 23,175, it clears the ceiling of the last three weeks and opens a step-by-step path:
Target 1: 23,489
Target 2: 23,593
Target 3: 23,890
Target 4: 24,143
Bearish: If Nifty breaks below 22,950, the bounce of the last few sessions starts to fade and a step-by-step slide opens:
Target 1: 22,870
Target 2: 22,760
Target 3: 22,670
Target 4: 22,500
Target 2 sits just above the 0.786 Fib (22,737.20), so expect some reaction around it. A move below 22,182 would break both the Weekly 200 EMA zone and the 1.0 Fib support. That would be a meaningful structural break, with 22,000 as the first level to watch, and further targets would be shared in the Notes of this idea.
Between 22,950 and 23,175, price is inside the range and neither trigger is active.
Beginner’s Lesson
A ceiling that price keeps touching but cannot clear, combined with higher lows underneath, is a common compression pattern. Each test of the ceiling uses up some of the sellers sitting there, and each higher low shows buyers arriving earlier. Traders watch these setups because the break, when it comes, is often sharp. It is still not a signal until price actually moves through the level, and the pattern can fail like any other. That is why this idea has a trigger and a set of targets for both sides, and why the space between the two triggers is best treated as a wait-and-watch zone.
Conclusion
Nifty has defended the Weekly 200 EMA for a fifth week and is pressing against the 23,140-23,175 ceiling again. A move above 23,175 would open the path toward 23,489, 23,593, 23,890 and 24,143. A break below 22,950 would open the path toward 22,870, 22,760, 22,670 and 22,500, and a move below 22,182 would shift the bias firmly bearish toward 22,000.
This is for educational purposes only and not investment advice. Please do your own research or consult a financial advisor before making any trading decisions.
Nifty closed the week at 23,053.10, up 453.10 points or 2.00%. The week started with a dip to 22,387.35, right at the Weekly 200 EMA (22,391.85), and buyers stepped in from there. Price pushed up to a high of 23,118.10 and held most of the gain into the close. That makes the fifth straight week the 22,182-22,391 zone has been defended.
Follow-up on Last Week’s View
Last week we flagged a move above 22,600 opening a path toward 22,735, 22,850, 23,000 and 23,140. Targets 1, 2 and 3 were achieved. Target 4 (23,140) was missed by about 22 points, with the week’s high at 23,118.10. The bearish trigger below 22,182 never came into play.
Pattern Explanation
The weekly lows keep rising: 22,179.90, then 22,288.45, then 22,372.00, and now 22,387.35. Buyers are defending the 200 EMA zone slightly higher each time.
On the upside, the weekly highs have been stuck in a narrow band: 23,149.85, then 23,175.25, and now 23,118.10. That is a flat ceiling, with the 0.618 Fib at 23,172.60 sitting inside it. Rising lows pressing into a flat ceiling is a compression that looks a lot like an ascending triangle. It is still only a setup until price actually breaks out of it.
Key Levels
Resistance 4: 24,143.15
Resistance 3: 23,890
Resistance 2: 23,592.85
Resistance 1: 23,489.85
Ceiling zone: 23,140.50-23,175 (0.618 Fib at 23,172.60)
Bearish trigger: below 22,950
Bearish targets: 22,870, 22,760, 22,670, 22,500
0.786 Fib: 22,737.20
Weekly 200 EMA: 22,391.85
Support: 22,288.45
Major Support / 1.0 Fib: 22,182.55
Psychological Support: 22,000
Scenarios
Bullish: If Nifty moves above 23,175, it clears the ceiling of the last three weeks and opens a step-by-step path:
Target 1: 23,489
Target 2: 23,593
Target 3: 23,890
Target 4: 24,143
Bearish: If Nifty breaks below 22,950, the bounce of the last few sessions starts to fade and a step-by-step slide opens:
Target 1: 22,870
Target 2: 22,760
Target 3: 22,670
Target 4: 22,500
Target 2 sits just above the 0.786 Fib (22,737.20), so expect some reaction around it. A move below 22,182 would break both the Weekly 200 EMA zone and the 1.0 Fib support. That would be a meaningful structural break, with 22,000 as the first level to watch, and further targets would be shared in the Notes of this idea.
Between 22,950 and 23,175, price is inside the range and neither trigger is active.
Beginner’s Lesson
A ceiling that price keeps touching but cannot clear, combined with higher lows underneath, is a common compression pattern. Each test of the ceiling uses up some of the sellers sitting there, and each higher low shows buyers arriving earlier. Traders watch these setups because the break, when it comes, is often sharp. It is still not a signal until price actually moves through the level, and the pattern can fail like any other. That is why this idea has a trigger and a set of targets for both sides, and why the space between the two triggers is best treated as a wait-and-watch zone.
Conclusion
Nifty has defended the Weekly 200 EMA for a fifth week and is pressing against the 23,140-23,175 ceiling again. A move above 23,175 would open the path toward 23,489, 23,593, 23,890 and 24,143. A break below 22,950 would open the path toward 22,870, 22,760, 22,670 and 22,500, and a move below 22,182 would shift the bias firmly bearish toward 22,000.
This is for educational purposes only and not investment advice. Please do your own research or consult a financial advisor before making any trading decisions.
Đóng lệnh: đạt mục tiêu
All 4 Bullish Targets Achieved ✅The original idea flagged Nifty defending the Weekly 200 EMA for a fifth week and pressing against the 23,140-23,175 ceiling. The bullish path needed a move above 23,175, with targets at 23,489, 23,593, 23,890 and 24,143.
That path played out in full. Nifty opened the week at 23,222.30, above the trigger, and rallied to a weekly high of 25,030.35, clearing all four targets and every resistance on the way up. The week closed at 25,030.35, up 1,977.25 points or 8.58%. The bearish side (below 22,950) was never triggered, and the Weekly 200 EMA (22,413.57) held as the base.
The week also closed above the August high of 24,774.30 and above 24,989.35, the level that had capped price since March.
What’s next
The nearest levels above on the chart are 25,213.65 and 25,476.40. On any pullback, the zone around 24,989 and then 24,601.70 (the old ceilings) is where buyers would need to show up for the breakout to hold. A move this large in one week can also bring sharp pullbacks, so a staged approach to booking profit makes sense.
Closing this update here.
This is for educational purposes only and not investment advice. Please do your own research or consult a financial advisor before making any trading decisions.

📈 HK Trading Community | Market Structure & Indicator Updates
Telegram: t.me/trendstrike1000
Website: quantumedgepro.netlify.app/
Real traders are built through learning,not tip hunting.So Start Learning How the Market Really Works
Telegram: t.me/trendstrike1000
Website: quantumedgepro.netlify.app/
Real traders are built through learning,not tip hunting.So Start Learning How the Market Really Works
Bài đăng liên quan
Thông báo miễn trừ trách nhiệm
Thông tin và các ấn phẩm này không nhằm mục đích, và không cấu thành, lời khuyên hoặc khuyến nghị về tài chính, đầu tư, giao dịch hay các loại khác do TradingView cung cấp hoặc xác nhận. Đọc thêm tại Điều khoản Sử dụng.
📈 HK Trading Community | Market Structure & Indicator Updates
Telegram: t.me/trendstrike1000
Website: quantumedgepro.netlify.app/
Real traders are built through learning,not tip hunting.So Start Learning How the Market Really Works
Telegram: t.me/trendstrike1000
Website: quantumedgepro.netlify.app/
Real traders are built through learning,not tip hunting.So Start Learning How the Market Really Works
Bài đăng liên quan
Thông báo miễn trừ trách nhiệm
Thông tin và các ấn phẩm này không nhằm mục đích, và không cấu thành, lời khuyên hoặc khuyến nghị về tài chính, đầu tư, giao dịch hay các loại khác do TradingView cung cấp hoặc xác nhận. Đọc thêm tại Điều khoản Sử dụng.