
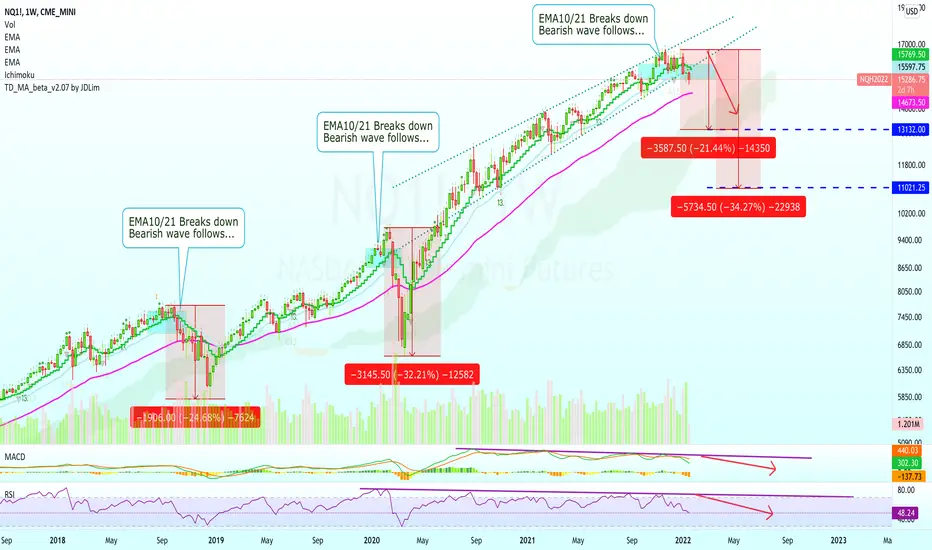
Here we have the NASDAQ (NQ1!) chart showing some bearish potential.
Last week prices closed below EMA10 and EMA21, when this happened in the past we had a strong correction.
We have the MACD trending down after a bearish cross.
We also have bearish Divergence with the MACD since August 2020:
The RSI is also trending lower as has broken below 50 weekly.
We have bearish divergence since Jan. 2020:
We see lower highs on the indicators (RSI and MACD) while we are getting higher highs on the NQ1!.
We have two main targets mapped on the chart.
Conditions for change
This analysis is invalidated if there is a weekly close above EMA10 or 15769.5 on the NQ1!.
Thank you for reading.
Namaste.
Last week prices closed below EMA10 and EMA21, when this happened in the past we had a strong correction.
We have the MACD trending down after a bearish cross.
We also have bearish Divergence with the MACD since August 2020:
The RSI is also trending lower as has broken below 50 weekly.
We have bearish divergence since Jan. 2020:
We see lower highs on the indicators (RSI and MACD) while we are getting higher highs on the NQ1!.
We have two main targets mapped on the chart.
Conditions for change
This analysis is invalidated if there is a weekly close above EMA10 or 15769.5 on the NQ1!.
Thank you for reading.
Namaste.
Giao dịch đang hoạt động
First target hit.More to come. We continue RED.
Đóng lệnh: đạt mục tiêu
Both targets hit.
Trading Cryptocurrencies can be the hardest undertaking ever without the right trade-numbers, without accurate private-access information. Free is free, but the best always requires sweat, an investment. Since 2017 👇
t.me/masteranandatrades/8778
t.me/masteranandatrades/8778
Bài đăng liên quan
Thông báo miễn trừ trách nhiệm
Thông tin và các ấn phẩm này không nhằm mục đích, và không cấu thành, lời khuyên hoặc khuyến nghị về tài chính, đầu tư, giao dịch hay các loại khác do TradingView cung cấp hoặc xác nhận. Đọc thêm tại Điều khoản Sử dụng.
Trading Cryptocurrencies can be the hardest undertaking ever without the right trade-numbers, without accurate private-access information. Free is free, but the best always requires sweat, an investment. Since 2017 👇
t.me/masteranandatrades/8778
t.me/masteranandatrades/8778
Bài đăng liên quan
Thông báo miễn trừ trách nhiệm
Thông tin và các ấn phẩm này không nhằm mục đích, và không cấu thành, lời khuyên hoặc khuyến nghị về tài chính, đầu tư, giao dịch hay các loại khác do TradingView cung cấp hoặc xác nhận. Đọc thêm tại Điều khoản Sử dụng.