
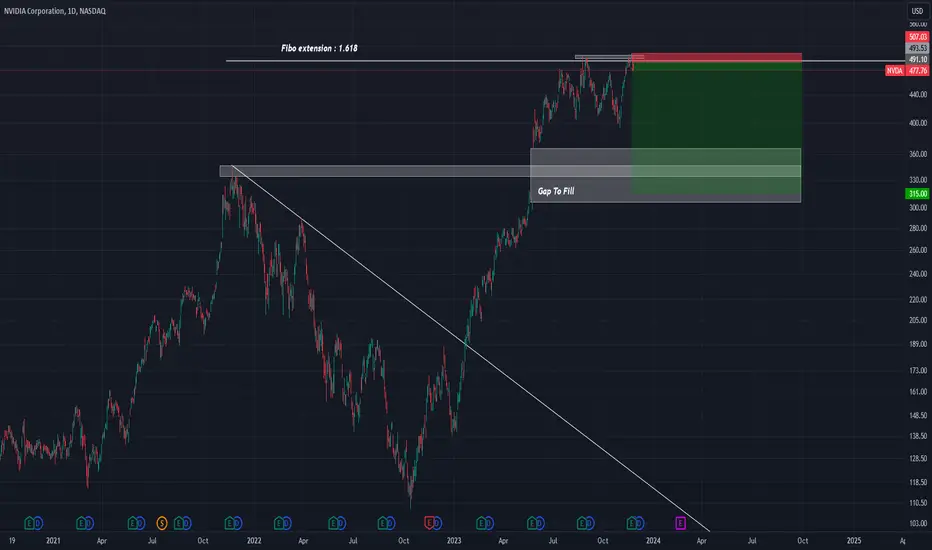
After a very big bull phase on the NVDA Stock, we start to see some reversal pattern on the 1.618 fibonacci level of extension. We can see the formation of lower lows and a stop hunting at the top (and near the extension level we are looking at).
What are we looking from ?
First we want to see the recent gap to be filled on this swing position (around the $315.0 level and the $306.0 50% of Fibonacci will be great but we can also see the $280.0 level of interest).
Then potentially, we can wait to see a bounce on this level for a long (but we are not here for now).
For me it's a strong short bias on this asset with decent R:R.
Great Trade !
What are we looking from ?
First we want to see the recent gap to be filled on this swing position (around the $315.0 level and the $306.0 50% of Fibonacci will be great but we can also see the $280.0 level of interest).
Then potentially, we can wait to see a bounce on this level for a long (but we are not here for now).
For me it's a strong short bias on this asset with decent R:R.
Great Trade !
Ghi chú
Level of support to watch : $468.0We want this level to break for a great continuation on the down side
This level can also be the level where we put the stop to BE and/or take a little profit
Ghi chú
Short seller are very strong on this assetLove to see the $475.0 level get rejected, so now we wait for the price to make new lows

Thông báo miễn trừ trách nhiệm
Thông tin và các ấn phẩm này không nhằm mục đích, và không cấu thành, lời khuyên hoặc khuyến nghị về tài chính, đầu tư, giao dịch hay các loại khác do TradingView cung cấp hoặc xác nhận. Đọc thêm tại Điều khoản Sử dụng.
Thông báo miễn trừ trách nhiệm
Thông tin và các ấn phẩm này không nhằm mục đích, và không cấu thành, lời khuyên hoặc khuyến nghị về tài chính, đầu tư, giao dịch hay các loại khác do TradingView cung cấp hoặc xác nhận. Đọc thêm tại Điều khoản Sử dụng.