
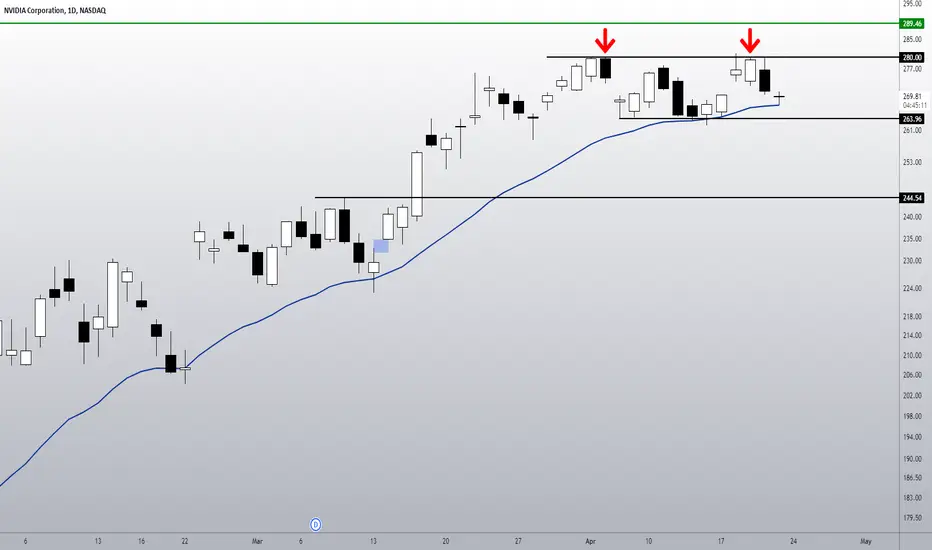
• NVDA is doing a pullback to its 21 ema, which is a normal movement. The problem is that this correction is occurring after it found a strong resistance at 280;
• This could be the beginning of a Double Top chart pattern. In order to trigger this pattern, NVDA would have to lose the 263 support line, which is the previous bottom area;
• In this scenario, NVDA would seek the 244, the next support line;
• In order to avoid this bearish thesis, it is important to see NVDA doing a bullish reaction, preferably above the 21 ema, and breaking the 280 as soon as possible;
• So far, it seems NDA is just doing some range trading between its two key support/resistance lines.
I’ll keep you updated on this. Remember to follow me to keep in touch with my daily analysis.
• This could be the beginning of a Double Top chart pattern. In order to trigger this pattern, NVDA would have to lose the 263 support line, which is the previous bottom area;
• In this scenario, NVDA would seek the 244, the next support line;
• In order to avoid this bearish thesis, it is important to see NVDA doing a bullish reaction, preferably above the 21 ema, and breaking the 280 as soon as possible;
• So far, it seems NDA is just doing some range trading between its two key support/resistance lines.
I’ll keep you updated on this. Remember to follow me to keep in touch with my daily analysis.

Bài đăng liên quan
Thông báo miễn trừ trách nhiệm
Thông tin và các ấn phẩm này không nhằm mục đích, và không cấu thành, lời khuyên hoặc khuyến nghị về tài chính, đầu tư, giao dịch hay các loại khác do TradingView cung cấp hoặc xác nhận. Đọc thêm tại Điều khoản Sử dụng.
Bài đăng liên quan
Thông báo miễn trừ trách nhiệm
Thông tin và các ấn phẩm này không nhằm mục đích, và không cấu thành, lời khuyên hoặc khuyến nghị về tài chính, đầu tư, giao dịch hay các loại khác do TradingView cung cấp hoặc xác nhận. Đọc thêm tại Điều khoản Sử dụng.