
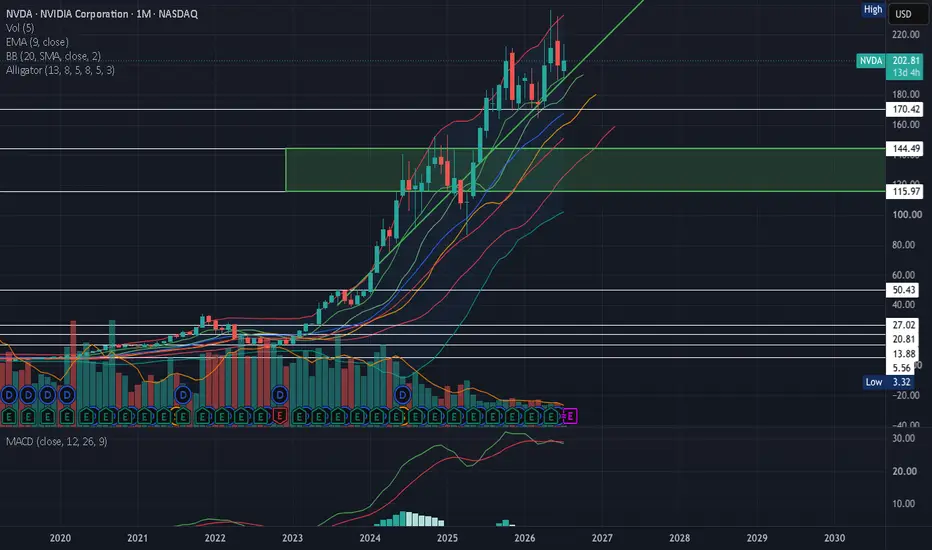
Chart Patterns: Ascending staircase (bullish) following the trendline (green).
Exponential Moving Average: EMA 9 (green line) is above EMA 21 (red line) bullish.
Bollinger Band (BB): NVDA is in the upper band (red) it could be bearish, however, let's check the volume to make sure this isn't signifying a reversal downwards.
Moving Average Convergence Divergence: The MACD (green line) is below the signal (red line) bearish.
Volume: The volume for last month (Monday 1, Jun 2026) is higher than this month's volume (Wednesday 1, Jul 2026). This month's volume is seeing an increase in bearish volume.
Williams Alligator: The lips (green line) are above the teeth (orange line), and jaw (red line), bullish. However, the distance between the three lines is getting smaller (bearish) signifying the end of this bullish trend.
Green Rectangular Box: This box represents support; where the most bullish activity is.
Opinion: Bearish on the 1-month chart. The chart looks like it has potential. NVDA closed on my green trendline, I see it going to my target $170.42, and with enough momentum I see it going to my next target $144.49.
Out of the money options (OTM): Puts.

Thông báo miễn trừ trách nhiệm
Thông tin và các ấn phẩm này không nhằm mục đích, và không cấu thành, lời khuyên hoặc khuyến nghị về tài chính, đầu tư, giao dịch hay các loại khác do TradingView cung cấp hoặc xác nhận. Đọc thêm tại Điều khoản Sử dụng.
Thông báo miễn trừ trách nhiệm
Thông tin và các ấn phẩm này không nhằm mục đích, và không cấu thành, lời khuyên hoặc khuyến nghị về tài chính, đầu tư, giao dịch hay các loại khác do TradingView cung cấp hoặc xác nhận. Đọc thêm tại Điều khoản Sử dụng.