
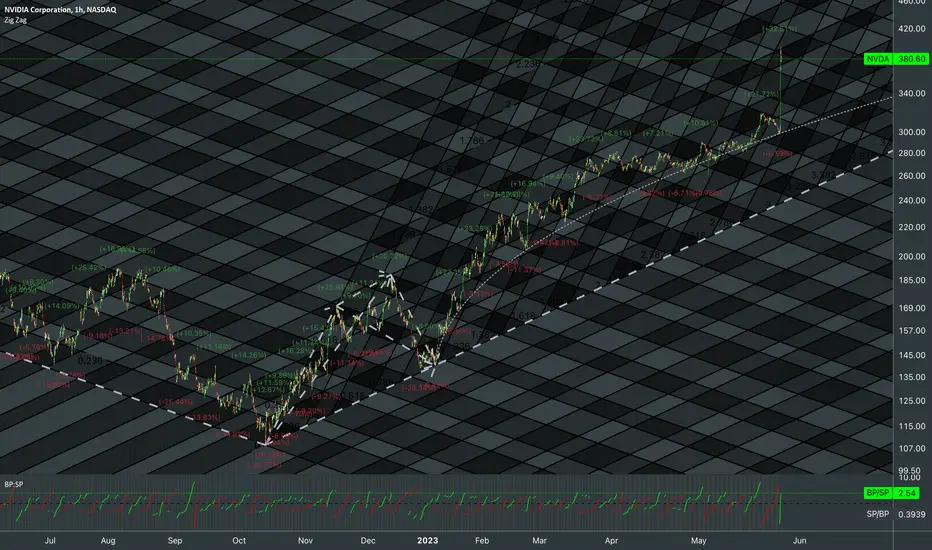
Relationship between ATH, Local bottom and first pullback in fibonacci ratio lines. Testing Buying Pressure / Selling Pressure volatility based indicator of measuring relationship between metrics of green and red candles separately. That's why there is 1 dashed line to indicate when they balance. Red line is SP / BP to see ongoing change in sellers' aspect.

Left part of the chart:

Left part of the chart:

🜲
Thông báo miễn trừ trách nhiệm
Thông tin và các ấn phẩm này không nhằm mục đích, và không cấu thành, lời khuyên hoặc khuyến nghị về tài chính, đầu tư, giao dịch hay các loại khác do TradingView cung cấp hoặc xác nhận. Đọc thêm tại Điều khoản Sử dụng.
Thông báo miễn trừ trách nhiệm
Thông tin và các ấn phẩm này không nhằm mục đích, và không cấu thành, lời khuyên hoặc khuyến nghị về tài chính, đầu tư, giao dịch hay các loại khác do TradingView cung cấp hoặc xác nhận. Đọc thêm tại Điều khoản Sử dụng.