
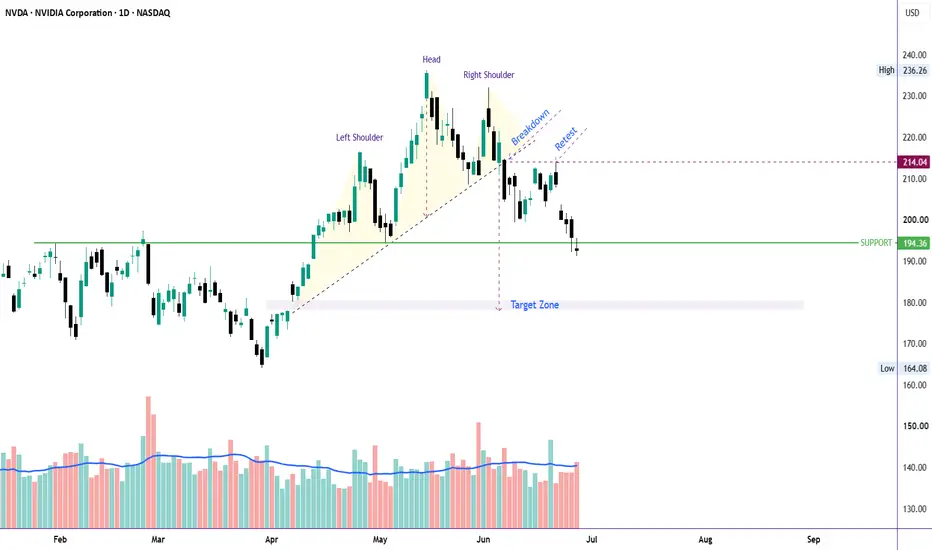
NVDA has confirmed a bearish technical breakdown after retesting the neckline of a previously broken Inverse Head & Shoulders and failing to reclaim it. Adding to the weakness, the stock has now broken below the major 194 support on strong volume, signaling increasing selling pressure.
Key Technical Observations:
📉 Failed retest of the Inverse Head & Shoulders breakout level, turning former support into resistance.
🔻 Decisive breakdown below the key 194 support with strong volume, confirming bearish momentum.
🎯 The next downside target lies around 178–180, where the stock may find temporary support.
⚠️ If selling pressure continues, a deeper correction cannot be ruled out.
Unless buyers quickly regain control, rallies are likely to be short-lived and corrective in nature.
Bullish Invalidation
This bearish thesis would be invalidated by a strong daily close above 215, which would indicate that buyers have reclaimed key resistance and the breakdown was likely a false move.
Until then, the technical outlook favors further downside, with 178–180 as the first key target.

📊 Charts → 🏗️ Structure → 🎯 Probability =📖 Chart Story
⏳ Patience → 🚀Success
🎯 If this setup makes sense to you, show it some support with a Boost.
⏳ Patience → 🚀Success
🎯 If this setup makes sense to you, show it some support with a Boost.
Thông báo miễn trừ trách nhiệm
Thông tin và các ấn phẩm này không nhằm mục đích, và không cấu thành, lời khuyên hoặc khuyến nghị về tài chính, đầu tư, giao dịch hay các loại khác do TradingView cung cấp hoặc xác nhận. Đọc thêm tại Điều khoản Sử dụng.