
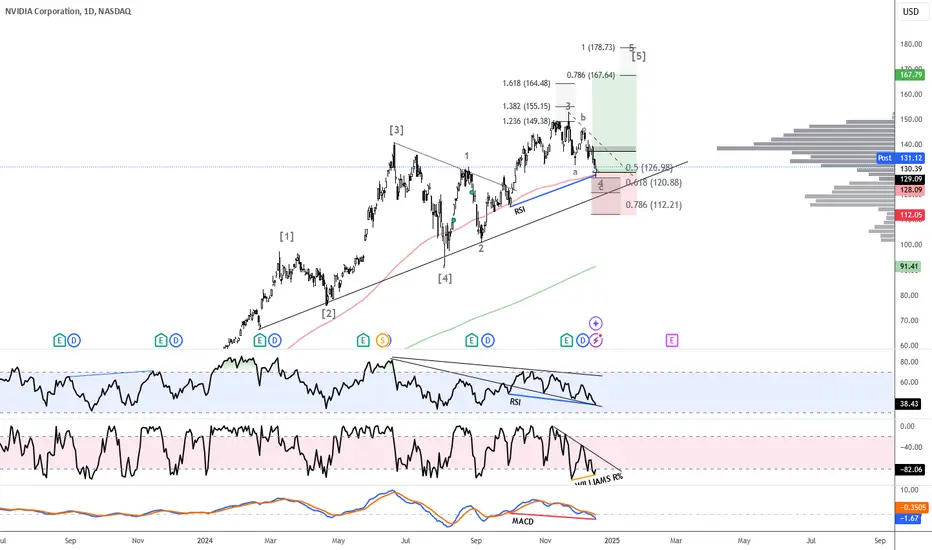
NVIDIA Corporation (NVDA) shows signs of a potential rebound based on Elliott Wave Theory and key technical indicators. The chart suggests that NVDA has likely completed a corrective Wave 4 and could be entering Wave 5, signaling a continuation of its primary bullish trend. Divergences in the Relative Strength Index (RSI), MACD, and Williams %R indicate that the recent pullback may be temporary.
The RSI shows a bullish divergence, with higher lows on the indicator while the price made lower lows, a common precursor to upward momentum. The MACD has turned upward, with a bullish crossover suggesting increasing buying interest. The Williams %R, which measures overbought and oversold conditions, also shows a divergence, indicating the stock may have been oversold and could be ready to reverse.
NVIDIA’s strong fundamentals, driven by increasing demand for AI infrastructure and GPUs, support this technical setup. Compared to gold and U.S. Treasury bonds, which have stabilized with minimal growth potential, NVIDIA offers significant upside as the chart signals a potential reversal and renewed bullish momentum.
The RSI shows a bullish divergence, with higher lows on the indicator while the price made lower lows, a common precursor to upward momentum. The MACD has turned upward, with a bullish crossover suggesting increasing buying interest. The Williams %R, which measures overbought and oversold conditions, also shows a divergence, indicating the stock may have been oversold and could be ready to reverse.
NVIDIA’s strong fundamentals, driven by increasing demand for AI infrastructure and GPUs, support this technical setup. Compared to gold and U.S. Treasury bonds, which have stabilized with minimal growth potential, NVIDIA offers significant upside as the chart signals a potential reversal and renewed bullish momentum.
Giao dịch đang hoạt động
+2% in pre-market rn 🚀 Ghi chú
SL -> BEĐóng lệnh: đạt mục tiêu
Ghi chú
Took all out at the last high**
Thông báo miễn trừ trách nhiệm
Thông tin và các ấn phẩm này không nhằm mục đích, và không cấu thành, lời khuyên hoặc khuyến nghị về tài chính, đầu tư, giao dịch hay các loại khác do TradingView cung cấp hoặc xác nhận. Đọc thêm tại Điều khoản Sử dụng.
Thông báo miễn trừ trách nhiệm
Thông tin và các ấn phẩm này không nhằm mục đích, và không cấu thành, lời khuyên hoặc khuyến nghị về tài chính, đầu tư, giao dịch hay các loại khác do TradingView cung cấp hoặc xác nhận. Đọc thêm tại Điều khoản Sử dụng.