
We all know that when it comes to trading stocks, volume is a key tool in our arsenal. It helps us judge the strength of a price move, assess breakouts and get a better feel for what's happening beneath the surface. But there's one problem with taking volume bars at face value: trading activity isn't evenly spread throughout the day.
US stocks tend to experience heavy activity around the market open, quieter conditions through the middle of the session and another increase towards the close. A large volume bar at the opening bell might therefore be perfectly normal, while a much smaller bar later in the day could represent something far more unusual.
This is where the Relative Volume at Time (RVOL at Time) indicator comes in. Rather than simply showing how much volume has traded, it puts that activity into context by comparing it with what we'd normally expect at that particular time of day.
Comparing like with like
The principle behind RVOL at Time is straightforward. On a five-minute chart, the indicator compares volume in a particular five-minute period with the average volume recorded during the corresponding period across previous trading sessions.
The result is expressed as a ratio. A reading of 1.0 means volume is in line with its historical average, while 2.0 means activity is running at twice the normal level. A reading of 0.5 indicates roughly half the usual activity.
This gives us a more meaningful way to assess whether a breakout, reversal or move through an important technical level is attracting unusual participation.
Importantly, RVOL measures activity, not buying or selling pressure. The direction of the price move still needs to come from the chart itself.
One setting makes a big difference
Before using the indicator, there's an important setting worth checking.
TradingView offers two calculation modes: Cumulative and Regular. The indicator defaults to Cumulative, but for examining individual price events, it generally makes sense to switch to Regular.
Cumulative compares the total volume traded so far during a session with the historical average accumulated to the same point. It's useful for understanding whether the session as a whole is unusually active.
Regular compares each individual candle with the historical average for that specific time interval.
Changing RVOL calculation mode to regular

Past performance is not a reliable indicator of future results
Imagine a stock trades quietly throughout the morning before suddenly breaking below support on exceptionally high volume. In Regular mode, that burst of activity stands out immediately. In Cumulative mode, it can be less obvious because the calculation includes all the volume traded earlier in the session.
Neither mode is better in every situation, but Regular is particularly useful when we want to examine the activity accompanying a specific candle or technical event.
Nvidia: A breakdown with unusual participation
The five-minute chart of Nvidia provides a good example.
During early October, Nvidia had been following a rising trendline. On 8 October, price broke sharply beneath that structure and accelerated lower.
NVDA Five-min Candle Chart

Past performance is not a reliable indicator of future results
What stands out is the accompanying increase in relative volume. As the breakdown developed, RVOL at Time moved well above its historical average, with several readings exceeding three times normal activity and the largest spikes reaching above four.
Rather than one isolated surge, we can see a cluster of elevated readings as Nvidia moved lower.
The trendline break already tells us that the price structure has changed. What RVOL adds is evidence that the move was accompanied by unusually high trading activity for those particular five-minute periods.
That doesn't mean the indicator predicted the decline or confirmed that sellers would remain in control. It simply gives us another piece of information to weigh alongside the price action.
Notice what happens afterwards. As the initial selling begins to settle, RVOL readings gradually return towards normal levels, even though Nvidia remains under pressure.
Unusually high activity can accompany the beginning of a significant move, but it doesn't need to remain elevated for that move to continue.
Looking at the bigger picture
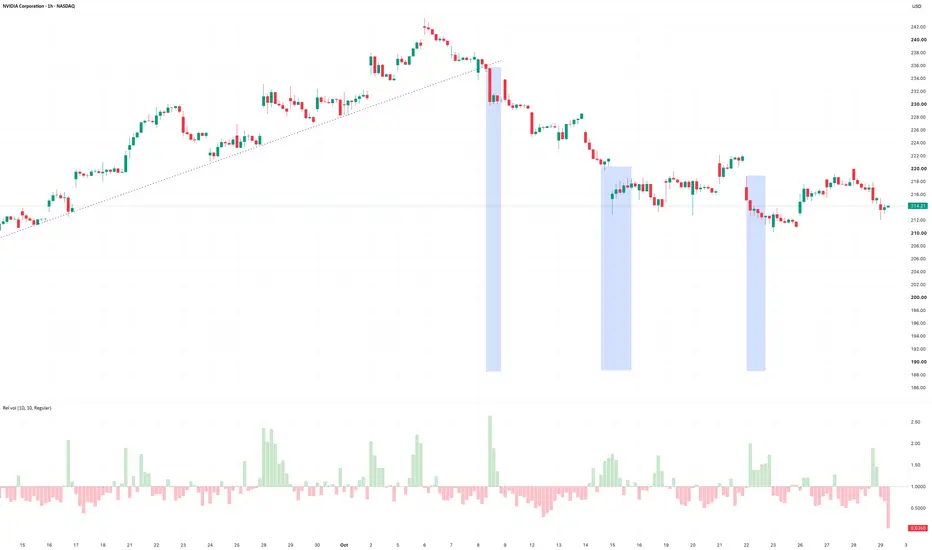
Moving up to Nvidia's hourly chart gives us a broader view of the same period.
NVDA Hourly Candle Chart

Past performance is not a reliable indicator of future results
The initial trendline breakdown remains clearly visible, along with a short burst of elevated RVOL. Over the following sessions, Nvidia continues to weaken, with further declines around the middle and latter part of October.
However, the relative volume readings vary considerably. Some periods of selling attract above-average activity, while others develop with readings closer to, or below, their historical norms.
This is an important distinction. A sharp move accompanied by elevated RVOL tells us that activity is unusually high, but it doesn't guarantee that the move will continue. Equally, a decline on relatively subdued volume doesn't necessarily mean the selling is about to end.
The hourly chart reinforces why RVOL works best alongside price structure, rather than as a standalone trading signal.
Putting RVOL to work
The most useful approach is to start with the price chart and identify the event you're interested in. That might be a breakout, a failed move through resistance or a test of an important support level.
Then use RVOL at Time to assess whether the activity accompanying that event is unusual.
The indicator is particularly useful on liquid stocks with reliable exchange-reported volume. It's worth remembering that volume data for other instruments, including some forex and CFD markets, may represent something different.
It's also important to consider the historical comparison. Earnings announcements, major news events and changes in market conditions can all influence what constitutes normal activity.
Ultimately, RVOL at Time isn't about finding a particular reading and treating it as a signal. It's about understanding the participation behind a price move.
A large volume bar isn't always unusual, and an unusually active period doesn't always produce a lasting move. By comparing trading activity with what we'd normally expect at that time of day, RVOL gives us a little more context when assessing what the market is doing.
Disclaimer: This is for information and learning purposes only. The information provided does not constitute investment advice nor take into account the individual financial circumstances or objectives of any investor. Any information that may be provided relating to past performance is not a reliable indicator of future results or performance. Social media channels are not relevant for UK residents.
Spread bets and CFDs are complex instruments and come with a high risk of losing money rapidly due to leverage. 89% of retail investor accounts lose money when trading spread bets and CFDs with this provider. You should consider whether you understand how spread bets and CFDs work and whether you can afford to take the high risk of losing your money.
US stocks tend to experience heavy activity around the market open, quieter conditions through the middle of the session and another increase towards the close. A large volume bar at the opening bell might therefore be perfectly normal, while a much smaller bar later in the day could represent something far more unusual.
This is where the Relative Volume at Time (RVOL at Time) indicator comes in. Rather than simply showing how much volume has traded, it puts that activity into context by comparing it with what we'd normally expect at that particular time of day.
Comparing like with like
The principle behind RVOL at Time is straightforward. On a five-minute chart, the indicator compares volume in a particular five-minute period with the average volume recorded during the corresponding period across previous trading sessions.
The result is expressed as a ratio. A reading of 1.0 means volume is in line with its historical average, while 2.0 means activity is running at twice the normal level. A reading of 0.5 indicates roughly half the usual activity.
This gives us a more meaningful way to assess whether a breakout, reversal or move through an important technical level is attracting unusual participation.
Importantly, RVOL measures activity, not buying or selling pressure. The direction of the price move still needs to come from the chart itself.
One setting makes a big difference
Before using the indicator, there's an important setting worth checking.
TradingView offers two calculation modes: Cumulative and Regular. The indicator defaults to Cumulative, but for examining individual price events, it generally makes sense to switch to Regular.
Cumulative compares the total volume traded so far during a session with the historical average accumulated to the same point. It's useful for understanding whether the session as a whole is unusually active.
Regular compares each individual candle with the historical average for that specific time interval.
Changing RVOL calculation mode to regular
Past performance is not a reliable indicator of future results
Imagine a stock trades quietly throughout the morning before suddenly breaking below support on exceptionally high volume. In Regular mode, that burst of activity stands out immediately. In Cumulative mode, it can be less obvious because the calculation includes all the volume traded earlier in the session.
Neither mode is better in every situation, but Regular is particularly useful when we want to examine the activity accompanying a specific candle or technical event.
Nvidia: A breakdown with unusual participation
The five-minute chart of Nvidia provides a good example.
During early October, Nvidia had been following a rising trendline. On 8 October, price broke sharply beneath that structure and accelerated lower.
NVDA Five-min Candle Chart
Past performance is not a reliable indicator of future results
What stands out is the accompanying increase in relative volume. As the breakdown developed, RVOL at Time moved well above its historical average, with several readings exceeding three times normal activity and the largest spikes reaching above four.
Rather than one isolated surge, we can see a cluster of elevated readings as Nvidia moved lower.
The trendline break already tells us that the price structure has changed. What RVOL adds is evidence that the move was accompanied by unusually high trading activity for those particular five-minute periods.
That doesn't mean the indicator predicted the decline or confirmed that sellers would remain in control. It simply gives us another piece of information to weigh alongside the price action.
Notice what happens afterwards. As the initial selling begins to settle, RVOL readings gradually return towards normal levels, even though Nvidia remains under pressure.
Unusually high activity can accompany the beginning of a significant move, but it doesn't need to remain elevated for that move to continue.
Looking at the bigger picture
Moving up to Nvidia's hourly chart gives us a broader view of the same period.
NVDA Hourly Candle Chart
Past performance is not a reliable indicator of future results
The initial trendline breakdown remains clearly visible, along with a short burst of elevated RVOL. Over the following sessions, Nvidia continues to weaken, with further declines around the middle and latter part of October.
However, the relative volume readings vary considerably. Some periods of selling attract above-average activity, while others develop with readings closer to, or below, their historical norms.
This is an important distinction. A sharp move accompanied by elevated RVOL tells us that activity is unusually high, but it doesn't guarantee that the move will continue. Equally, a decline on relatively subdued volume doesn't necessarily mean the selling is about to end.
The hourly chart reinforces why RVOL works best alongside price structure, rather than as a standalone trading signal.
Putting RVOL to work
The most useful approach is to start with the price chart and identify the event you're interested in. That might be a breakout, a failed move through resistance or a test of an important support level.
Then use RVOL at Time to assess whether the activity accompanying that event is unusual.
The indicator is particularly useful on liquid stocks with reliable exchange-reported volume. It's worth remembering that volume data for other instruments, including some forex and CFD markets, may represent something different.
It's also important to consider the historical comparison. Earnings announcements, major news events and changes in market conditions can all influence what constitutes normal activity.
Ultimately, RVOL at Time isn't about finding a particular reading and treating it as a signal. It's about understanding the participation behind a price move.
A large volume bar isn't always unusual, and an unusually active period doesn't always produce a lasting move. By comparing trading activity with what we'd normally expect at that time of day, RVOL gives us a little more context when assessing what the market is doing.
Disclaimer: This is for information and learning purposes only. The information provided does not constitute investment advice nor take into account the individual financial circumstances or objectives of any investor. Any information that may be provided relating to past performance is not a reliable indicator of future results or performance. Social media channels are not relevant for UK residents.
Spread bets and CFDs are complex instruments and come with a high risk of losing money rapidly due to leverage. 89% of retail investor accounts lose money when trading spread bets and CFDs with this provider. You should consider whether you understand how spread bets and CFDs work and whether you can afford to take the high risk of losing your money.

Thông báo miễn trừ trách nhiệm
Thông tin và các ấn phẩm này không nhằm mục đích, và không cấu thành, lời khuyên hoặc khuyến nghị về tài chính, đầu tư, giao dịch hay các loại khác do TradingView cung cấp hoặc xác nhận. Đọc thêm tại Điều khoản Sử dụng.
Thông báo miễn trừ trách nhiệm
Thông tin và các ấn phẩm này không nhằm mục đích, và không cấu thành, lời khuyên hoặc khuyến nghị về tài chính, đầu tư, giao dịch hay các loại khác do TradingView cung cấp hoặc xác nhận. Đọc thêm tại Điều khoản Sử dụng.