
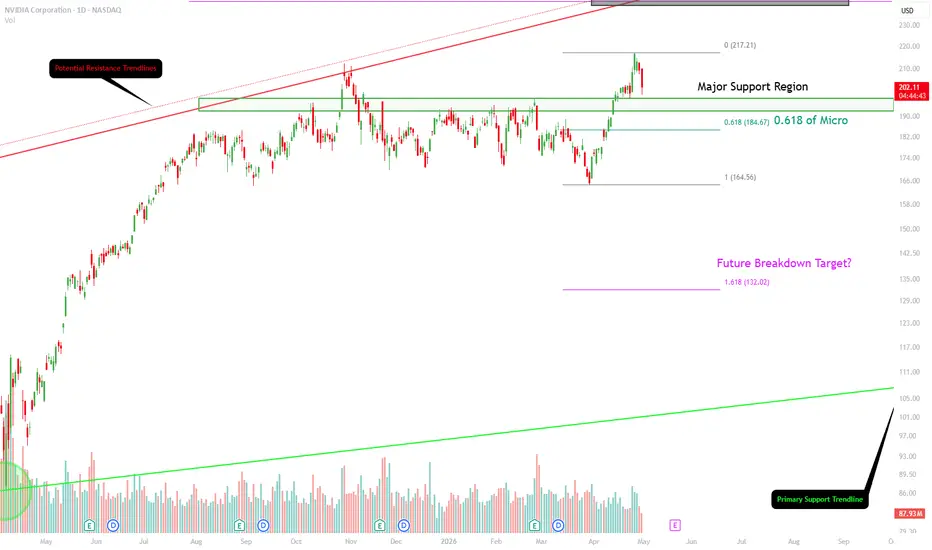
After the price action over the past few days it is really important to examine both the higher timeframe and lower timeframe structure for NVDA.
Here was my last idea outlining the $240-$250 target:
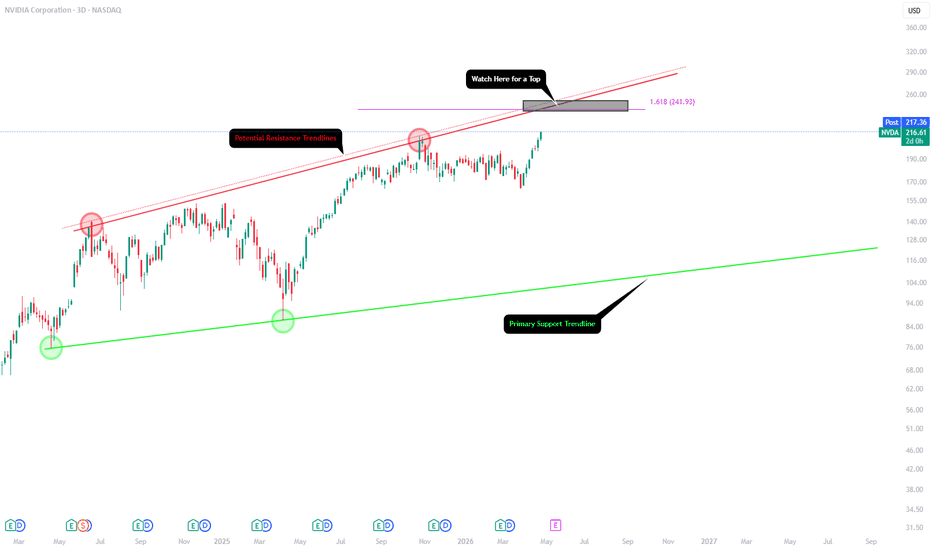
Those price targets can absolutely still be reached, but it is all going to come down to how the lower timeframe structure develops over the coming days.
3D Timeframe: Important Development
The first thing to address is what has occurred on the 3D timeframe. Yesterday price closed as a 3D doji, which could be the first signal of a failed breakout continuation and a potential reversal to the downside. Since that close, price has already dropped 4.4% towards the $200 level.

It is also worth noting that this could be forming a 3D double top on the line chart based on candle body closes. This has not been confirmed yet, but given that the doji has printed it is important to understand this development on the higher timeframe in case it does lead to a top being established. It is not a perfect double top since the second high is slightly higher, but this could be forming a bearish divergence on the 3D. Higher high in price but a lower high on the RSI.

Lower Timeframe: The Bullish Case
Before drawing any conclusions we must examine the lower timeframe structure first, as what develops here could negate the higher timeframe concern and allow the rally toward $240 to $250 to continue.
NVDA should have significant support built at the previous highs. The green box I have drawn ranges from $192 to $200. Given the recent breakout, market participants should be looking at this region on the lower timeframe as a discounted entry opportunity for a further push to new highs.
If this region does not hold, the next level of support would be the 0.618 Fibonacci of the micro trend around $184 to $185. This was the midrange of the extended chop zone NVDA traded within for many months and should act as meaningful support if price drops that far.
Higher Timeframe: The Bearish Target
Now that the lower timeframe bullish case has been laid out, we must also examine the higher timeframe bearish breakdown hypothesis.
If the 3D doji does mark the top and the 3D line chart solidifies a double top, where does the breakdown target sit?
Based on Fibonacci levels the 1.618 extension target comes in around $132. What makes this level particularly compelling is how closely it aligns with the breakdown targets I outlined in this previous post:
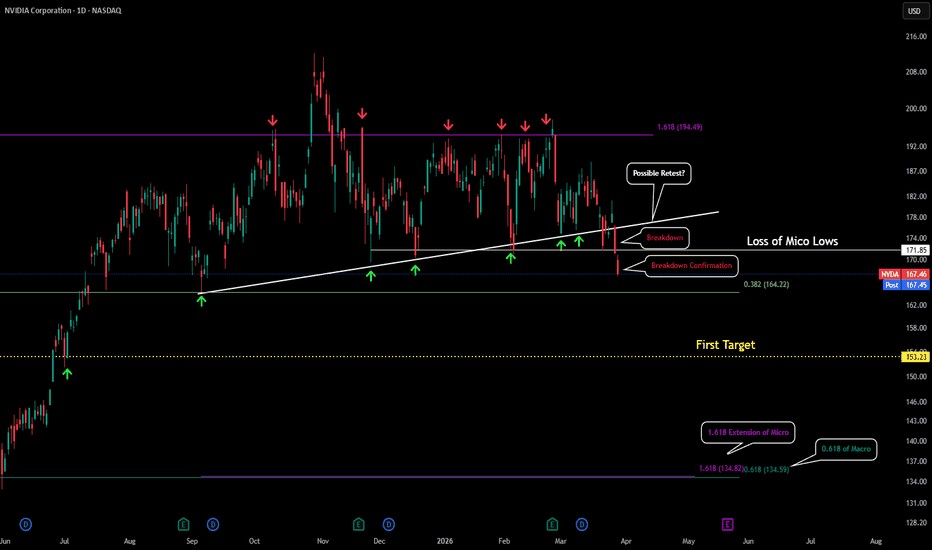
That was of course before NVDA held the 0.382 as support and pushed to new highs, but both scenarios are worth keeping on your radar as NVDA trades within this extremely important price region over the next few weeks.
Here was my last idea outlining the $240-$250 target:
Those price targets can absolutely still be reached, but it is all going to come down to how the lower timeframe structure develops over the coming days.
3D Timeframe: Important Development
The first thing to address is what has occurred on the 3D timeframe. Yesterday price closed as a 3D doji, which could be the first signal of a failed breakout continuation and a potential reversal to the downside. Since that close, price has already dropped 4.4% towards the $200 level.
It is also worth noting that this could be forming a 3D double top on the line chart based on candle body closes. This has not been confirmed yet, but given that the doji has printed it is important to understand this development on the higher timeframe in case it does lead to a top being established. It is not a perfect double top since the second high is slightly higher, but this could be forming a bearish divergence on the 3D. Higher high in price but a lower high on the RSI.
Lower Timeframe: The Bullish Case
Before drawing any conclusions we must examine the lower timeframe structure first, as what develops here could negate the higher timeframe concern and allow the rally toward $240 to $250 to continue.
NVDA should have significant support built at the previous highs. The green box I have drawn ranges from $192 to $200. Given the recent breakout, market participants should be looking at this region on the lower timeframe as a discounted entry opportunity for a further push to new highs.
If this region does not hold, the next level of support would be the 0.618 Fibonacci of the micro trend around $184 to $185. This was the midrange of the extended chop zone NVDA traded within for many months and should act as meaningful support if price drops that far.
Higher Timeframe: The Bearish Target
Now that the lower timeframe bullish case has been laid out, we must also examine the higher timeframe bearish breakdown hypothesis.
If the 3D doji does mark the top and the 3D line chart solidifies a double top, where does the breakdown target sit?
Based on Fibonacci levels the 1.618 extension target comes in around $132. What makes this level particularly compelling is how closely it aligns with the breakdown targets I outlined in this previous post:
That was of course before NVDA held the 0.382 as support and pushed to new highs, but both scenarios are worth keeping on your radar as NVDA trades within this extremely important price region over the next few weeks.

Thông báo miễn trừ trách nhiệm
Thông tin và các ấn phẩm này không nhằm mục đích, và không cấu thành, lời khuyên hoặc khuyến nghị về tài chính, đầu tư, giao dịch hay các loại khác do TradingView cung cấp hoặc xác nhận. Đọc thêm tại Điều khoản Sử dụng.
Thông báo miễn trừ trách nhiệm
Thông tin và các ấn phẩm này không nhằm mục đích, và không cấu thành, lời khuyên hoặc khuyến nghị về tài chính, đầu tư, giao dịch hay các loại khác do TradingView cung cấp hoặc xác nhận. Đọc thêm tại Điều khoản Sử dụng.