
## NASDAQ: NVDA — Rectangle Breakout & Throwback Test
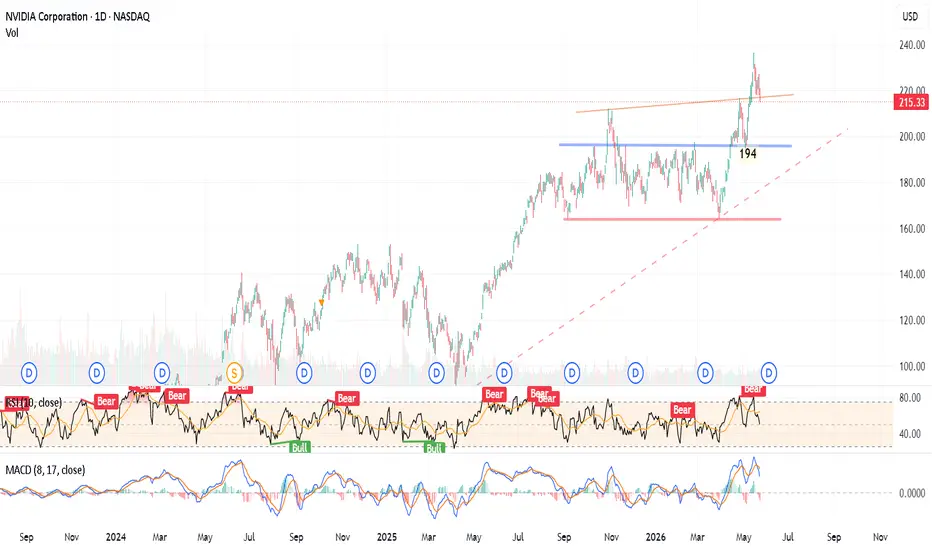
**NVIDIA Corporation (NVDA)** has broken out of a massive multi-month rectangle consolidation zone on the daily chart and is currently executing a standard technical throwback to validate old resistance as new support.
---
### Setup Breakdown
* **The Range:** For months, the price fluctuated inside a massive horizontal rectangle bounds, capped by a firm resistance ceiling at **194 USD** (blue line) and a solid floor near **162 USD** (pink line).
* **The Breakout & Peak:** Price explosively cleared the **194 USD** barrier, rallying to print a fresh local high just under the minor upper resistance trendline (orange line).
* **The Throwback:** The stock is currently pulling back to **215.33 USD**, heading down to test the major breakout structural level at **194 USD** alongside the macro ascending support trendline (dashed red line).
---
### Indicators
* **RSI (10):** Dropped to **50.24** from the overbought "Bear" zone, successfully cooling down structural extensions and stabilizing at the neutral midline.
* **MACD (8, 17):** Displaying a short-term bearish crossover above the zero line, confirming a healthy, corrective pullback rather than structural distribution.
---
### Action Plan
* **Trigger:** Buy on confirmed daily price rejection (e.g., pin bar or engulfing candle) at the **194 USD** horizontal shelf.
* **Targets:** **225 USD** $\rightarrow$ **240 USD** (testing the upper trendline target).
* **Stop Loss:** A daily close below **188 USD** breaks back inside the old range and invalidates the immediate throwback setup.
**NVIDIA Corporation (NVDA)** has broken out of a massive multi-month rectangle consolidation zone on the daily chart and is currently executing a standard technical throwback to validate old resistance as new support.
---
### Setup Breakdown
* **The Range:** For months, the price fluctuated inside a massive horizontal rectangle bounds, capped by a firm resistance ceiling at **194 USD** (blue line) and a solid floor near **162 USD** (pink line).
* **The Breakout & Peak:** Price explosively cleared the **194 USD** barrier, rallying to print a fresh local high just under the minor upper resistance trendline (orange line).
* **The Throwback:** The stock is currently pulling back to **215.33 USD**, heading down to test the major breakout structural level at **194 USD** alongside the macro ascending support trendline (dashed red line).
---
### Indicators
* **RSI (10):** Dropped to **50.24** from the overbought "Bear" zone, successfully cooling down structural extensions and stabilizing at the neutral midline.
* **MACD (8, 17):** Displaying a short-term bearish crossover above the zero line, confirming a healthy, corrective pullback rather than structural distribution.
---
### Action Plan
* **Trigger:** Buy on confirmed daily price rejection (e.g., pin bar or engulfing candle) at the **194 USD** horizontal shelf.
* **Targets:** **225 USD** $\rightarrow$ **240 USD** (testing the upper trendline target).
* **Stop Loss:** A daily close below **188 USD** breaks back inside the old range and invalidates the immediate throwback setup.

Thông báo miễn trừ trách nhiệm
Thông tin và các ấn phẩm này không nhằm mục đích, và không cấu thành, lời khuyên hoặc khuyến nghị về tài chính, đầu tư, giao dịch hay các loại khác do TradingView cung cấp hoặc xác nhận. Đọc thêm tại Điều khoản Sử dụng.
Thông báo miễn trừ trách nhiệm
Thông tin và các ấn phẩm này không nhằm mục đích, và không cấu thành, lời khuyên hoặc khuyến nghị về tài chính, đầu tư, giao dịch hay các loại khác do TradingView cung cấp hoặc xác nhận. Đọc thêm tại Điều khoản Sử dụng.