

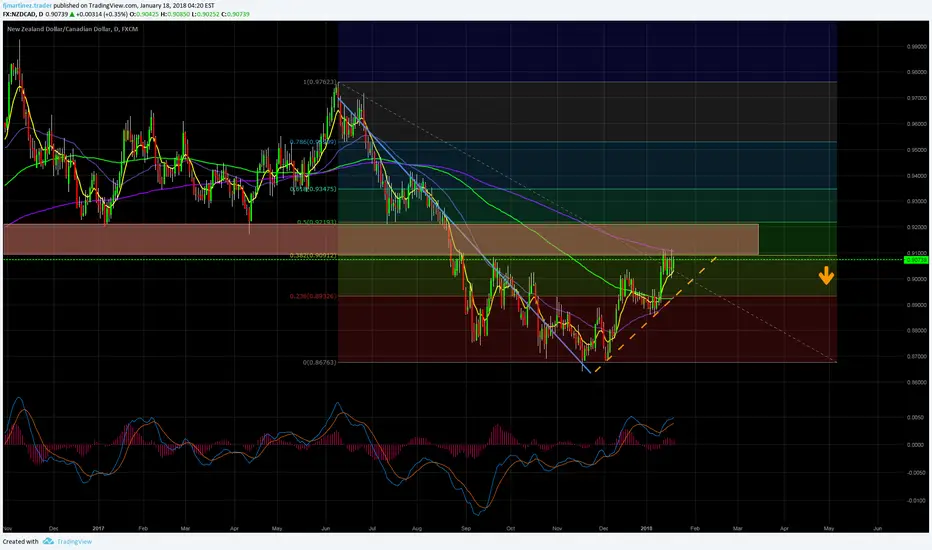
With the NZDCAD we have the reverse situation as I writed in the EURAUD analysis , it is in an downward rally, is inside correction and is finding an historic support area coinciding with fibonacci level of 38% and is touching the 300 WMA. It could be a signal showing the end of the correction.
I draw a trend line (Orange line) and if it is crossed downward and the 150 WMA (Green) is crossed too, I'll open a sell order with:
- Partial close 0.8710
- Stop loss 0.9260.
- Last partial close, moving the stop loss.
Remember:
You Never should convert a Winning position into a lossing position
I draw a trend line (Orange line) and if it is crossed downward and the 150 WMA (Green) is crossed too, I'll open a sell order with:
- Partial close 0.8710
- Stop loss 0.9260.
- Last partial close, moving the stop loss.
Remember:
You Never should convert a Winning position into a lossing position

Thông báo miễn trừ trách nhiệm
Thông tin và các ấn phẩm này không nhằm mục đích, và không cấu thành, lời khuyên hoặc khuyến nghị về tài chính, đầu tư, giao dịch hay các loại khác do TradingView cung cấp hoặc xác nhận. Đọc thêm tại Điều khoản Sử dụng.
Thông báo miễn trừ trách nhiệm
Thông tin và các ấn phẩm này không nhằm mục đích, và không cấu thành, lời khuyên hoặc khuyến nghị về tài chính, đầu tư, giao dịch hay các loại khác do TradingView cung cấp hoặc xác nhận. Đọc thêm tại Điều khoản Sử dụng.