

Hey guys,
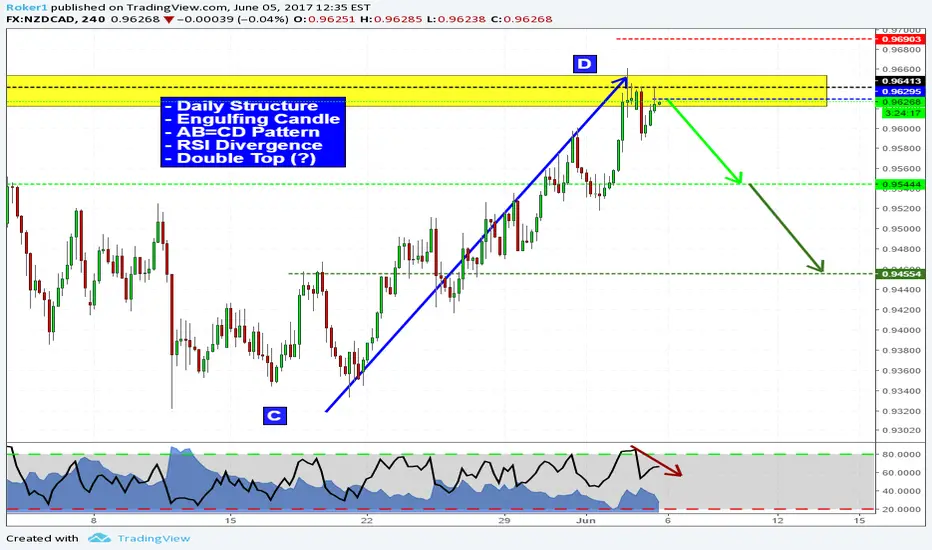
this is the 4hr chart on NZDCAD but my analysis, as usual, starts from higher timeframes: on the daily price has just touched a key level of structure (yellow box) along with the D point of an AB=CD pattern. As we go on lower timeframes such as 4hr you can see price has formed a pinbar followed by an engulfing red candle in overbought condition. Then at the retest of the highs we see RSI divergence and less strength in price action.
These are all good signs for a reversal. Let's see how it plays out.
Stops above highs, targets as displayed above.
If you have any question or if you want to share your view, feel free to comment below.
Otherwise, see you in the next chart!
this is the 4hr chart on NZDCAD but my analysis, as usual, starts from higher timeframes: on the daily price has just touched a key level of structure (yellow box) along with the D point of an AB=CD pattern. As we go on lower timeframes such as 4hr you can see price has formed a pinbar followed by an engulfing red candle in overbought condition. Then at the retest of the highs we see RSI divergence and less strength in price action.
These are all good signs for a reversal. Let's see how it plays out.
Stops above highs, targets as displayed above.
If you have any question or if you want to share your view, feel free to comment below.
Otherwise, see you in the next chart!
Đóng lệnh: dừng lỗ

Thông báo miễn trừ trách nhiệm
Thông tin và các ấn phẩm này không nhằm mục đích, và không cấu thành, lời khuyên hoặc khuyến nghị về tài chính, đầu tư, giao dịch hay các loại khác do TradingView cung cấp hoặc xác nhận. Đọc thêm tại Điều khoản Sử dụng.
Thông báo miễn trừ trách nhiệm
Thông tin và các ấn phẩm này không nhằm mục đích, và không cấu thành, lời khuyên hoặc khuyến nghị về tài chính, đầu tư, giao dịch hay các loại khác do TradingView cung cấp hoặc xác nhận. Đọc thêm tại Điều khoản Sử dụng.