

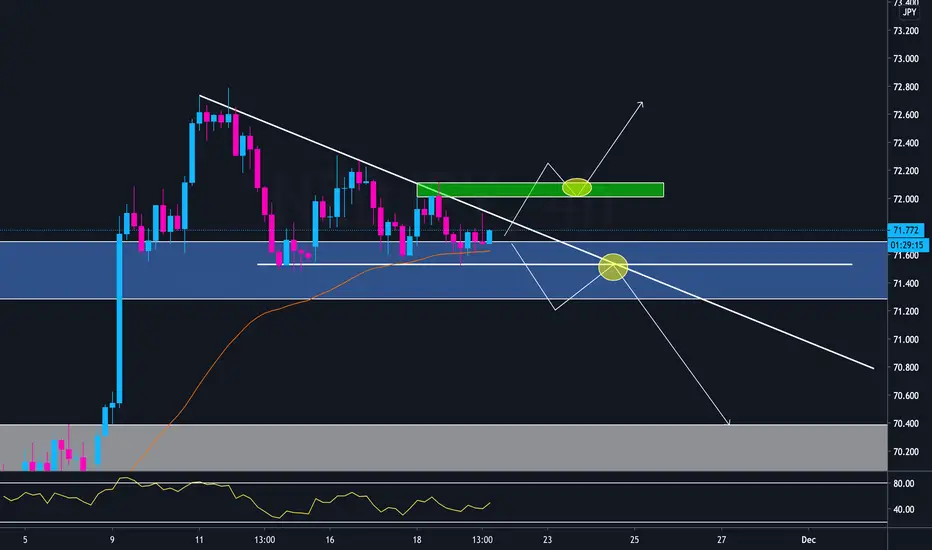
NZDJPY is showing a descending triangle formation at a key area of resistance. When we zoom out to the weekly, we can see the previous weekly candle showed a rejection of this zone and the current weekly candle is showing low bullish momentum. This pair has more potential to breakout to the downside rather than the upside but the market can do whatever it wants. For sells i'll be looking for a break of support and a retest, for buys i'll look for a break and retest of resistance.

Thông báo miễn trừ trách nhiệm
Thông tin và các ấn phẩm này không nhằm mục đích, và không cấu thành, lời khuyên hoặc khuyến nghị về tài chính, đầu tư, giao dịch hay các loại khác do TradingView cung cấp hoặc xác nhận. Đọc thêm tại Điều khoản Sử dụng.
Thông báo miễn trừ trách nhiệm
Thông tin và các ấn phẩm này không nhằm mục đích, và không cấu thành, lời khuyên hoặc khuyến nghị về tài chính, đầu tư, giao dịch hay các loại khác do TradingView cung cấp hoặc xác nhận. Đọc thêm tại Điều khoản Sử dụng.