

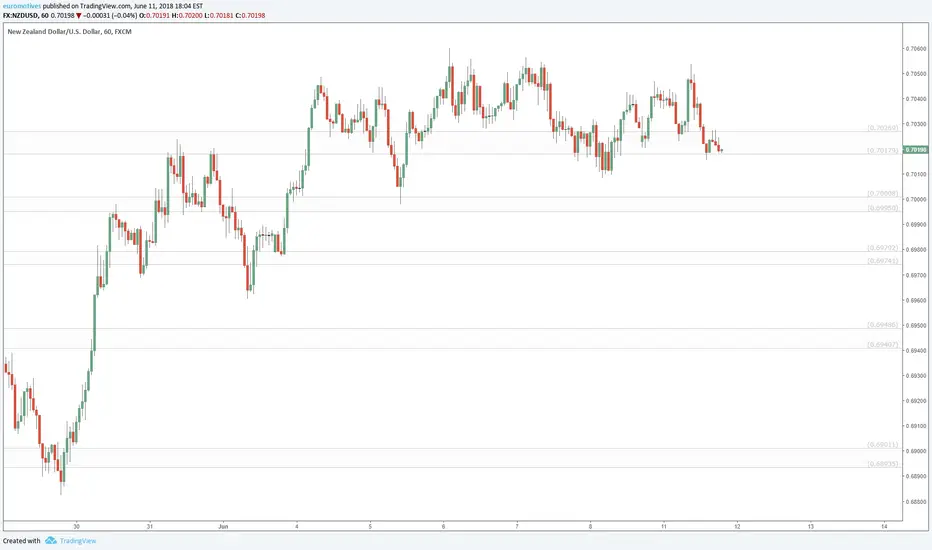
These zones are calculated using Fibonacci Ratios of past price moves.
Where prices overlap, drag the Right (price) Axis up to magnify and reduce overlap vertically.
There are zones above and below the current window, Drag the Chart up/down to see other zones.
Drag bottom axis to the left to magnify the candle size to view close up.
I will update as new zones are defined by upcoming Fibs.
Where prices overlap, drag the Right (price) Axis up to magnify and reduce overlap vertically.
There are zones above and below the current window, Drag the Chart up/down to see other zones.
Drag bottom axis to the left to magnify the candle size to view close up.
I will update as new zones are defined by upcoming Fibs.
Ghi chú
Even in times of high volatility (FOMC decision/conference), the Fib boundaries are still obeyed.Ghi chú
my NU zones are admitedly not so good, but looks to be headed to .685 quicklys3.amazonaws.com/tradingview/snapshots/0/0dSRKJjp.png

the Golden Ratio is my Religion
the Trading View is my Nation
the Moderator Tag is my Flag
the Trading View is my Nation
the Moderator Tag is my Flag
Bài đăng liên quan
Thông báo miễn trừ trách nhiệm
Thông tin và các ấn phẩm này không nhằm mục đích, và không cấu thành, lời khuyên hoặc khuyến nghị về tài chính, đầu tư, giao dịch hay các loại khác do TradingView cung cấp hoặc xác nhận. Đọc thêm tại Điều khoản Sử dụng.
the Golden Ratio is my Religion
the Trading View is my Nation
the Moderator Tag is my Flag
the Trading View is my Nation
the Moderator Tag is my Flag
Bài đăng liên quan
Thông báo miễn trừ trách nhiệm
Thông tin và các ấn phẩm này không nhằm mục đích, và không cấu thành, lời khuyên hoặc khuyến nghị về tài chính, đầu tư, giao dịch hay các loại khác do TradingView cung cấp hoặc xác nhận. Đọc thêm tại Điều khoản Sử dụng.