

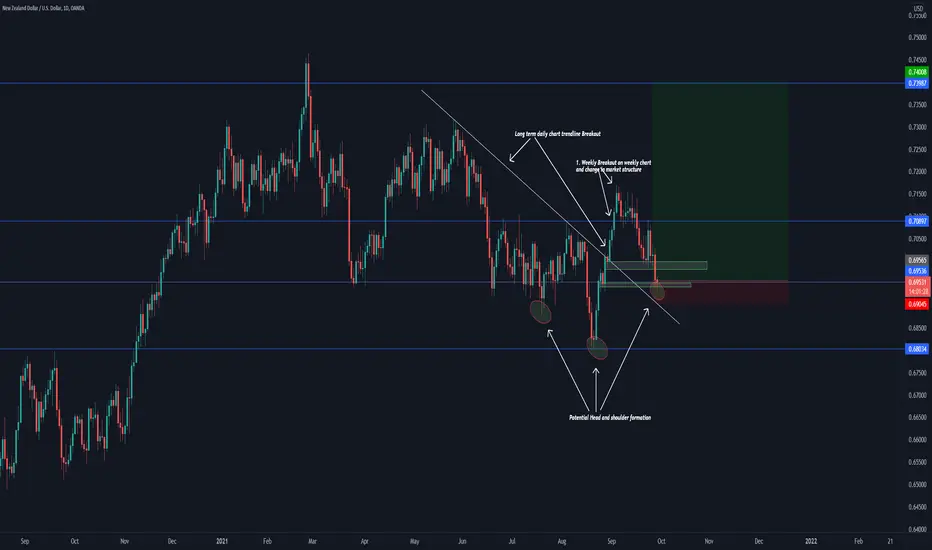
List of confluences:
1: Weekly chart breakout and chart in market structure.
2: Weekly and daily Chart short to medium term trendline breakout.
3: Potential Head and shoulder formation on daily chart
Summary:
When we look on the weekly time frame, we can see a clear bullish market structure change and breakout. Usually after such a strong breakout we tend to see a very strong pull back which lasted just over two weeks in this case and is visible on the daily time frame as well.
Most the traders who took this setup right after the weekly candle breakout had a strong potential of getting stopped out so its advise to wait a few days before looking for entries. When looking at the weekly and daily chart, we can see
a breakout of a short to medium term trendline. After the breakout we can see a very strong pull back as stated above. Lastly we can see the potential formation of a head and shoulders pattern which further confirms out long basis on the NZDUSD pair.
This trade will be left to run for about 2 to 3 week or until the target is reached, which ever comes first. Targets are set using Fibonacci. Lets see how this plays out.
1: Weekly chart breakout and chart in market structure.
2: Weekly and daily Chart short to medium term trendline breakout.
3: Potential Head and shoulder formation on daily chart
Summary:
When we look on the weekly time frame, we can see a clear bullish market structure change and breakout. Usually after such a strong breakout we tend to see a very strong pull back which lasted just over two weeks in this case and is visible on the daily time frame as well.
Most the traders who took this setup right after the weekly candle breakout had a strong potential of getting stopped out so its advise to wait a few days before looking for entries. When looking at the weekly and daily chart, we can see
a breakout of a short to medium term trendline. After the breakout we can see a very strong pull back as stated above. Lastly we can see the potential formation of a head and shoulders pattern which further confirms out long basis on the NZDUSD pair.
This trade will be left to run for about 2 to 3 week or until the target is reached, which ever comes first. Targets are set using Fibonacci. Lets see how this plays out.
Ghi chú
Trade stopped out, will re-enter, and change the target!
Thông báo miễn trừ trách nhiệm
Thông tin và các ấn phẩm này không nhằm mục đích, và không cấu thành, lời khuyên hoặc khuyến nghị về tài chính, đầu tư, giao dịch hay các loại khác do TradingView cung cấp hoặc xác nhận. Đọc thêm tại Điều khoản Sử dụng.
Thông báo miễn trừ trách nhiệm
Thông tin và các ấn phẩm này không nhằm mục đích, và không cấu thành, lời khuyên hoặc khuyến nghị về tài chính, đầu tư, giao dịch hay các loại khác do TradingView cung cấp hoặc xác nhận. Đọc thêm tại Điều khoản Sử dụng.