Ocean chart analysis
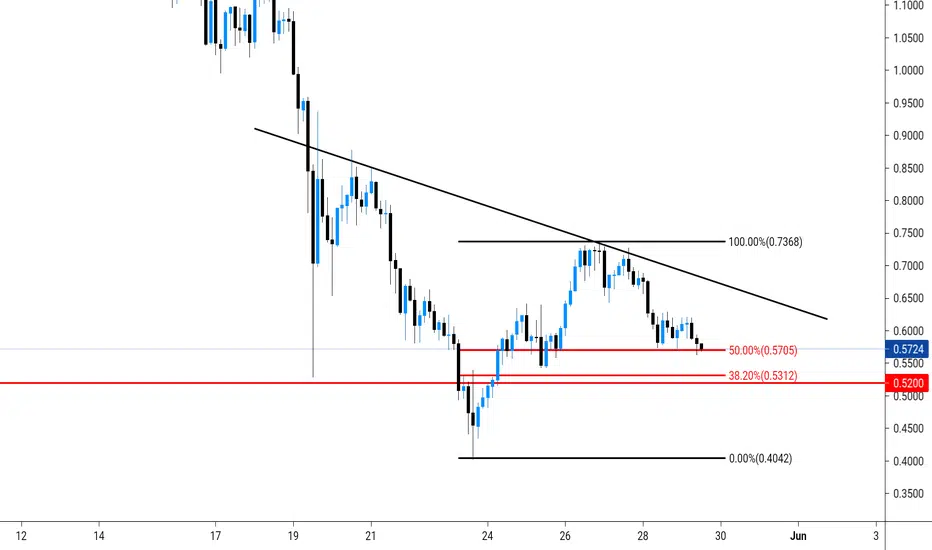
#OCEAN 3H USDT CHART ANALYSIS...
Ocean Now Just Above It's Weekly Strong Support Zone. If It's Can't Hold This Level, It Will Be More Bad For Ocean. So Weekly Candle Should Be Close Above Thid Support Zone 0.52$. On The Other Side It's Creating A Inverse Head & Shoulder Pattern. You Can Buy After Breakout The Neckline.
Short Term Trader Always Stop-loss. Invest How Much You Can Afford To Loss. Always Verify Your Own Analysis.
Ocean Now Just Above It's Weekly Strong Support Zone. If It's Can't Hold This Level, It Will Be More Bad For Ocean. So Weekly Candle Should Be Close Above Thid Support Zone 0.52$. On The Other Side It's Creating A Inverse Head & Shoulder Pattern. You Can Buy After Breakout The Neckline.
Short Term Trader Always Stop-loss. Invest How Much You Can Afford To Loss. Always Verify Your Own Analysis.

Thông báo miễn trừ trách nhiệm
Thông tin và các ấn phẩm này không nhằm mục đích, và không cấu thành, lời khuyên hoặc khuyến nghị về tài chính, đầu tư, giao dịch hay các loại khác do TradingView cung cấp hoặc xác nhận. Đọc thêm tại Điều khoản Sử dụng.
Thông báo miễn trừ trách nhiệm
Thông tin và các ấn phẩm này không nhằm mục đích, và không cấu thành, lời khuyên hoặc khuyến nghị về tài chính, đầu tư, giao dịch hay các loại khác do TradingView cung cấp hoặc xác nhận. Đọc thêm tại Điều khoản Sử dụng.