Cập nhật
OIL - Key Fibonacci Levels and Potential Market Moves
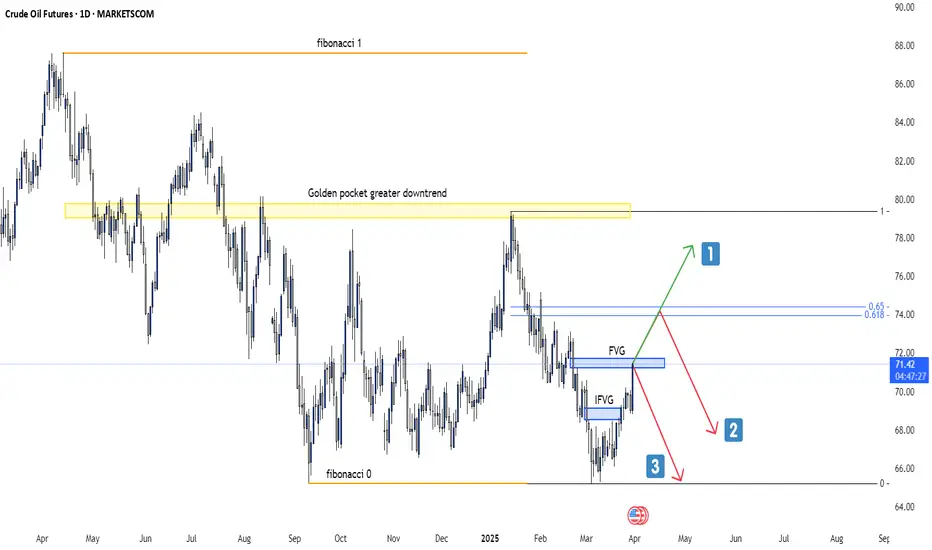
This chart presents a detailed technical analysis of Crude Oil Futures on the 1D timeframe, highlighting key Fibonacci levels, Fair Value Gaps (FVGs), and potential price movements.
Key observations:
- The price is currently around $71.44, moving towards a key decision zone.
- A significant Fibonacci retracement zone (0.618 - 0.65) is marked near $74, aligning with a key resistance area.
- The "Golden Pocket" from the greater downtrend remains a crucial area to watch for a potential reversal.
- Two Fair Value Gaps (FVG & IFVG) are identified, which could act as liquidity zones.
Possible Scenarios:
🟢 Option 1: Bullish breakout, price moves above $74 and continues toward $78+ levels.
🔴 Option 2: Rejection from resistance, leading to a potential pullback below $70.
🔴 Option 3: Strong rejection, price drops back towards the Fibonacci 0 level (~$64).
Which option do you think is most likely? Let me know your thoughts! 🚀📉
Key observations:
- The price is currently around $71.44, moving towards a key decision zone.
- A significant Fibonacci retracement zone (0.618 - 0.65) is marked near $74, aligning with a key resistance area.
- The "Golden Pocket" from the greater downtrend remains a crucial area to watch for a potential reversal.
- Two Fair Value Gaps (FVG & IFVG) are identified, which could act as liquidity zones.
Possible Scenarios:
🟢 Option 1: Bullish breakout, price moves above $74 and continues toward $78+ levels.
🔴 Option 2: Rejection from resistance, leading to a potential pullback below $70.
🔴 Option 3: Strong rejection, price drops back towards the Fibonacci 0 level (~$64).
Which option do you think is most likely? Let me know your thoughts! 🚀📉
Giao dịch đang hoạt động
gap has been inversed!
MY LINKS
📈 Free Signals
bit.ly/3YxiRXr
💬 Discord Community
bit.ly/4jHHA3O
💵 Favorite Exchange
bit.ly/4lBeTXt
📈 Free Signals
bit.ly/3YxiRXr
💬 Discord Community
bit.ly/4jHHA3O
💵 Favorite Exchange
bit.ly/4lBeTXt
Thông báo miễn trừ trách nhiệm
Thông tin và các ấn phẩm này không nhằm mục đích, và không cấu thành, lời khuyên hoặc khuyến nghị về tài chính, đầu tư, giao dịch hay các loại khác do TradingView cung cấp hoặc xác nhận. Đọc thêm tại Điều khoản Sử dụng.
MY LINKS
📈 Free Signals
bit.ly/3YxiRXr
💬 Discord Community
bit.ly/4jHHA3O
💵 Favorite Exchange
bit.ly/4lBeTXt
📈 Free Signals
bit.ly/3YxiRXr
💬 Discord Community
bit.ly/4jHHA3O
💵 Favorite Exchange
bit.ly/4lBeTXt
Thông báo miễn trừ trách nhiệm
Thông tin và các ấn phẩm này không nhằm mục đích, và không cấu thành, lời khuyên hoặc khuyến nghị về tài chính, đầu tư, giao dịch hay các loại khác do TradingView cung cấp hoặc xác nhận. Đọc thêm tại Điều khoản Sử dụng.