
Daily Reversal Tested as 150 Becomes the Battleground
Oracle enters the new week at an important technical decision point. The Daily chart has made a meaningful improvement by breaking the longer-term descending trendline, but the 1H chart has turned bearish after a strong rejection from resistance. At the same time, the 1H GEX map has ORCL trading below the important 150 HVL in negative gamma.
For me, this creates a simple question for Sept. 14–18: can ORCL defend the larger Daily recovery and reclaim 150, or will the short-term weakness continue toward 145 and possibly 140?
Daily Structure
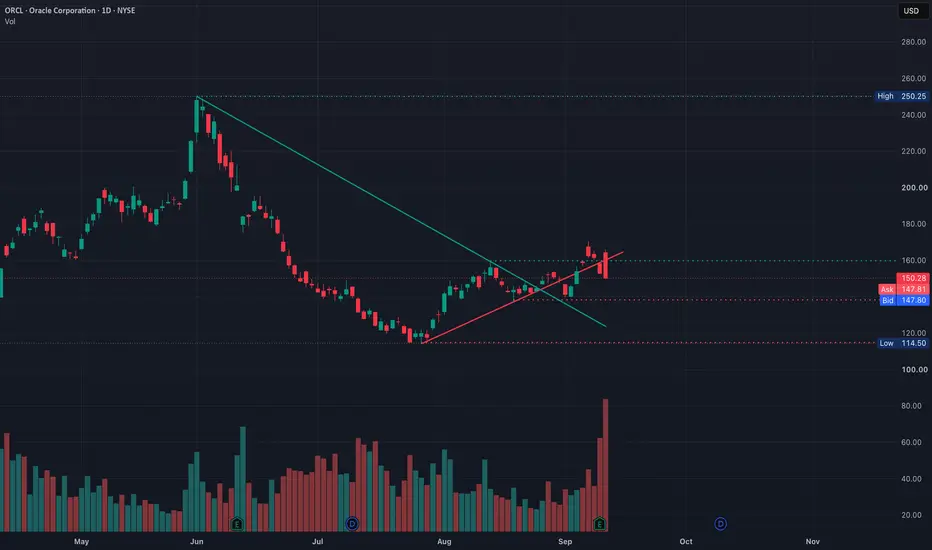
I always start with the Daily because it tells me what the larger structure is doing before I look at the lower timeframe. ORCL peaked around 250.25 in June and then spent several months making lower highs and lower lows. The descending trendline from that high controlled the stock through June, July and into August.
That trendline has now been broken, which is the first meaningful improvement in the larger structure. ORCL established a major low around 114.50 and then recovered through August and early September. However, breaking a bearish trendline does not automatically create a new bullish trend. Buyers still need to establish higher support and successfully break the next major resistance.
The first important Daily resistance is around 160. ORCL recently traded above that area but couldn't hold it and has now pulled back toward 147.80. For me, the broader recovery remains alive while the major support structure around 140 holds. If buyers eventually reclaim 160, I would watch the 166–170 area next, followed by the larger resistance around 184–185.
1H Confirmation

The 1H chart is where I become more cautious. ORCL recently pushed into approximately 166, directly underneath the larger supply area, and sellers rejected the move aggressively. Price subsequently lost 160, 155 and 150 before reaching approximately 147.81.
That gives the 1H a clearly bearish short-term structure. Price is below the short-term trend structure, the chart is showing a support break, and RSI has fallen to approximately 21. This tells me momentum is weak, but it also tells me the stock is already stretched. Because of that, I don't want to chase puts after a large decline.
The first thing I want to see Monday is how ORCL reacts around 150. If a bounce cannot reclaim 150–151, sellers still control the short-term structure. If buyers recover 150 and then push through 153–155, the 1H begins repairing itself. A recovery above 160 would be a much stronger change in character.
GEX Positioning

The 1H GEX map helps confirm why these price levels matter. ORCL is around 147.81 while the HVL sits near 150, meaning price has moved underneath an important gamma pivot. The GEX environment is also negative. I don't interpret negative gamma as automatically bearish; instead, it tells me dealer hedging can amplify movement once an important level breaks.
Below price, 145 is the first important GEX area, followed by approximately 142 and the major put wall/POI around 140. What gets my attention is that the 140 GEX level also lines up with the broader Daily support structure. When the technical chart and options positioning identify approximately the same area, I give that level more importance.
Above price, the GEX map gives us a clear ladder. The first major level is 150, followed by approximately 155 and the stronger C1 around 160. If ORCL can recover through those areas, the next GEX levels sit around 165, 170, 175 and 180.
How I Put It Together
The three charts are not completely aligned, and that's actually what makes this setup interesting. The Daily says the larger downtrend has been challenged and a recovery is developing. The 1H says sellers currently control the short-term move. GEX shows ORCL below the 150 HVL in negative gamma, which could allow the next confirmed break to travel farther.
Because of that, I enter the week with a neutral-to-bearish short-term bias, but I'm not interested in blindly chasing puts. I want price to confirm the next move.
Bullish Scenario
For the bullish case, ORCL first needs to reclaim 150 and prove it can hold that level as support. If that happens, 153–155 becomes the next test. A recovery through 155 would tell me the 1H selloff is beginning to repair itself and put 160 back into play.
A clean reclaim of 160 would be much more important because the lower timeframe would then begin aligning with the improving Daily structure. Above 160, I would watch 165 and 170 as the next major upside areas.
Bearish Scenario
If ORCL attempts to bounce but continues rejecting below 150, sellers maintain the advantage. The next important test becomes 145. A clean break below 145 would make the GEX levels around 142 and 140 increasingly important.
The 140 area is the major downside decision zone for me. If buyers defend it, ORCL could establish a larger Daily higher low and keep the recovery structure alive. If 140 breaks decisively, I would become much more skeptical about the Daily reversal.
Options Outlook
For calls, I prefer confirmation rather than trying to catch the exact bottom. A reclaim and hold above 150 improves the setup, while a move through 155 makes calls more interesting because 160 becomes the next major GEX target.
For puts, I would rather see a failed rebound into 150 or a confirmed break below 145 than chase ORCL after an already extended selloff. Below 145, I would watch 142 and 140. The 1H RSI is already deeply oversold, so risk/reward becomes more important than simply being correct about direction.
Conclusion
ORCL enters Sept. 14–18 with the Daily and short-term charts telling different stories. The Daily is attempting to build a larger reversal, while the 1H has turned bearish and GEX has price below the 150 HVL in negative gamma.
For me, 150 is the main decision level this week. Reclaiming 150 and then 155 would shift my attention back toward 160 and potentially 165–170. Staying below 150 and losing 145 would shift my attention toward 142 and especially 140.
I don't need to predict the entire week before it starts. I want ORCL to show which side controls these levels, and then I can trade with that confirmation instead of guessing.
Educational analysis only. Not financial advice.
Oracle enters the new week at an important technical decision point. The Daily chart has made a meaningful improvement by breaking the longer-term descending trendline, but the 1H chart has turned bearish after a strong rejection from resistance. At the same time, the 1H GEX map has ORCL trading below the important 150 HVL in negative gamma.
For me, this creates a simple question for Sept. 14–18: can ORCL defend the larger Daily recovery and reclaim 150, or will the short-term weakness continue toward 145 and possibly 140?
Daily Structure
I always start with the Daily because it tells me what the larger structure is doing before I look at the lower timeframe. ORCL peaked around 250.25 in June and then spent several months making lower highs and lower lows. The descending trendline from that high controlled the stock through June, July and into August.
That trendline has now been broken, which is the first meaningful improvement in the larger structure. ORCL established a major low around 114.50 and then recovered through August and early September. However, breaking a bearish trendline does not automatically create a new bullish trend. Buyers still need to establish higher support and successfully break the next major resistance.
The first important Daily resistance is around 160. ORCL recently traded above that area but couldn't hold it and has now pulled back toward 147.80. For me, the broader recovery remains alive while the major support structure around 140 holds. If buyers eventually reclaim 160, I would watch the 166–170 area next, followed by the larger resistance around 184–185.
1H Confirmation
The 1H chart is where I become more cautious. ORCL recently pushed into approximately 166, directly underneath the larger supply area, and sellers rejected the move aggressively. Price subsequently lost 160, 155 and 150 before reaching approximately 147.81.
That gives the 1H a clearly bearish short-term structure. Price is below the short-term trend structure, the chart is showing a support break, and RSI has fallen to approximately 21. This tells me momentum is weak, but it also tells me the stock is already stretched. Because of that, I don't want to chase puts after a large decline.
The first thing I want to see Monday is how ORCL reacts around 150. If a bounce cannot reclaim 150–151, sellers still control the short-term structure. If buyers recover 150 and then push through 153–155, the 1H begins repairing itself. A recovery above 160 would be a much stronger change in character.
GEX Positioning
The 1H GEX map helps confirm why these price levels matter. ORCL is around 147.81 while the HVL sits near 150, meaning price has moved underneath an important gamma pivot. The GEX environment is also negative. I don't interpret negative gamma as automatically bearish; instead, it tells me dealer hedging can amplify movement once an important level breaks.
Below price, 145 is the first important GEX area, followed by approximately 142 and the major put wall/POI around 140. What gets my attention is that the 140 GEX level also lines up with the broader Daily support structure. When the technical chart and options positioning identify approximately the same area, I give that level more importance.
Above price, the GEX map gives us a clear ladder. The first major level is 150, followed by approximately 155 and the stronger C1 around 160. If ORCL can recover through those areas, the next GEX levels sit around 165, 170, 175 and 180.
How I Put It Together
The three charts are not completely aligned, and that's actually what makes this setup interesting. The Daily says the larger downtrend has been challenged and a recovery is developing. The 1H says sellers currently control the short-term move. GEX shows ORCL below the 150 HVL in negative gamma, which could allow the next confirmed break to travel farther.
Because of that, I enter the week with a neutral-to-bearish short-term bias, but I'm not interested in blindly chasing puts. I want price to confirm the next move.
Bullish Scenario
For the bullish case, ORCL first needs to reclaim 150 and prove it can hold that level as support. If that happens, 153–155 becomes the next test. A recovery through 155 would tell me the 1H selloff is beginning to repair itself and put 160 back into play.
A clean reclaim of 160 would be much more important because the lower timeframe would then begin aligning with the improving Daily structure. Above 160, I would watch 165 and 170 as the next major upside areas.
Bearish Scenario
If ORCL attempts to bounce but continues rejecting below 150, sellers maintain the advantage. The next important test becomes 145. A clean break below 145 would make the GEX levels around 142 and 140 increasingly important.
The 140 area is the major downside decision zone for me. If buyers defend it, ORCL could establish a larger Daily higher low and keep the recovery structure alive. If 140 breaks decisively, I would become much more skeptical about the Daily reversal.
Options Outlook
For calls, I prefer confirmation rather than trying to catch the exact bottom. A reclaim and hold above 150 improves the setup, while a move through 155 makes calls more interesting because 160 becomes the next major GEX target.
For puts, I would rather see a failed rebound into 150 or a confirmed break below 145 than chase ORCL after an already extended selloff. Below 145, I would watch 142 and 140. The 1H RSI is already deeply oversold, so risk/reward becomes more important than simply being correct about direction.
Conclusion
ORCL enters Sept. 14–18 with the Daily and short-term charts telling different stories. The Daily is attempting to build a larger reversal, while the 1H has turned bearish and GEX has price below the 150 HVL in negative gamma.
For me, 150 is the main decision level this week. Reclaiming 150 and then 155 would shift my attention back toward 160 and potentially 165–170. Staying below 150 and losing 145 would shift my attention toward 142 and especially 140.
I don't need to predict the entire week before it starts. I want ORCL to show which side controls these levels, and then I can trade with that confirmation instead of guessing.
Educational analysis only. Not financial advice.

Built for traders who want clarity, not noise.
bullbearxinsights.app
bullbearxinsights.app
Thông báo miễn trừ trách nhiệm
Thông tin và các ấn phẩm này không nhằm mục đích, và không cấu thành, lời khuyên hoặc khuyến nghị về tài chính, đầu tư, giao dịch hay các loại khác do TradingView cung cấp hoặc xác nhận. Đọc thêm tại Điều khoản Sử dụng.
Built for traders who want clarity, not noise.
bullbearxinsights.app
bullbearxinsights.app
Thông báo miễn trừ trách nhiệm
Thông tin và các ấn phẩm này không nhằm mục đích, và không cấu thành, lời khuyên hoặc khuyến nghị về tài chính, đầu tư, giao dịch hay các loại khác do TradingView cung cấp hoặc xác nhận. Đọc thêm tại Điều khoản Sử dụng.