
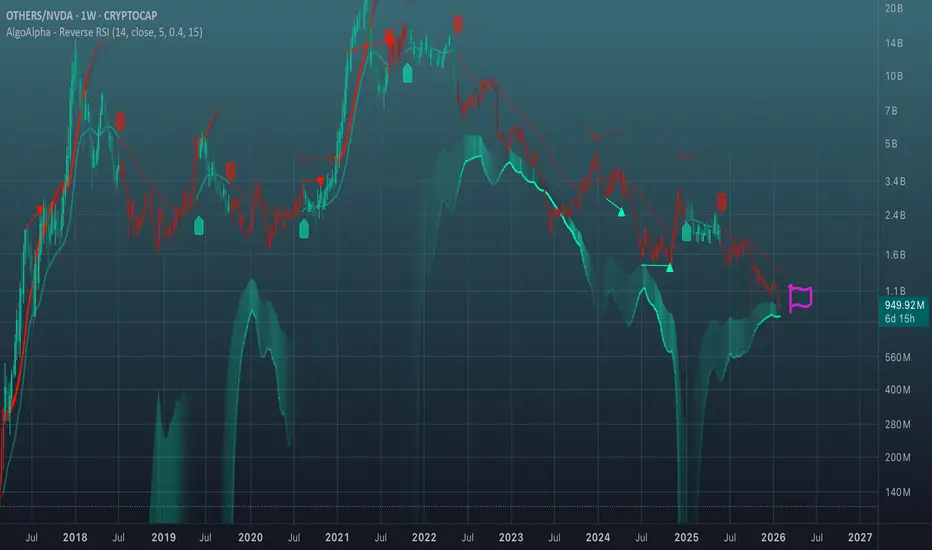
This chart demonstrates exactly the same process that I described in the OTHERS/XAUSD chart. Well, except that there is still a little way to go before it touches the line. While we are looking at the dominance of OTHERS and the dominance of Bitcoin, right now there are two powerful contenders for liquidity flow.
Ghi chú
In addition, let's consider 1M using Polynomial Regression Channel
and Price Heat Meter (both from ChartPrime).
The monthly regression channel shows a return of the aggressive
upward channel as early as March-April. The candlestick may
bounce right off it. The Price Heat Meter shows the formation of
Lower extremes print an aqua % label (possible exhaustion/support context).
But one such support has already been broken, so the one that is forming now should work.
Ghi chú

Thông báo miễn trừ trách nhiệm
Thông tin và các ấn phẩm này không nhằm mục đích, và không cấu thành, lời khuyên hoặc khuyến nghị về tài chính, đầu tư, giao dịch hay các loại khác do TradingView cung cấp hoặc xác nhận. Đọc thêm tại Điều khoản Sử dụng.
Thông báo miễn trừ trách nhiệm
Thông tin và các ấn phẩm này không nhằm mục đích, và không cấu thành, lời khuyên hoặc khuyến nghị về tài chính, đầu tư, giao dịch hay các loại khác do TradingView cung cấp hoặc xác nhận. Đọc thêm tại Điều khoản Sử dụng.