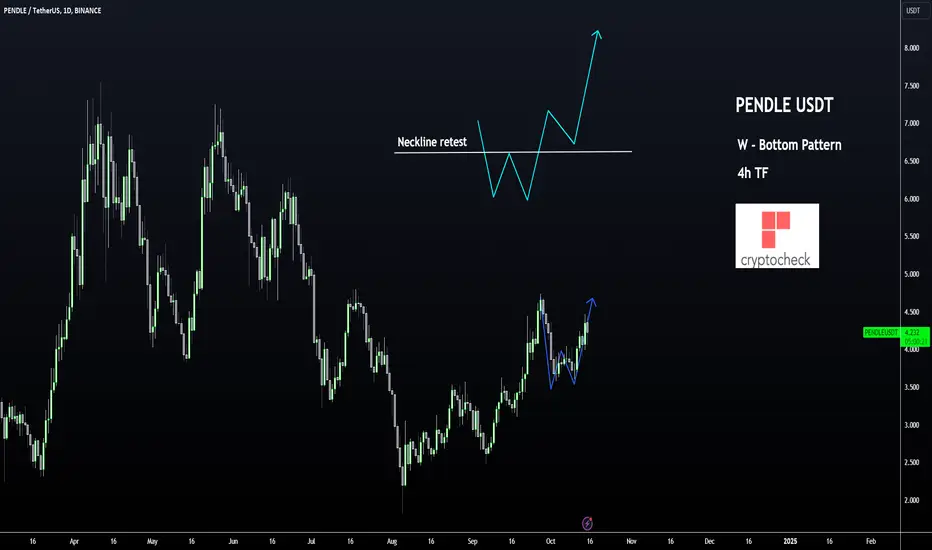
PENDLE has formed a W-Bottom Chart Pattern in the Daily timeframe, which could signal more upside is coming.
We're also observing very distinctive higher lows and higher highs; a key sign of a bullish market.
The W-Bottom pattern hasn't quite finished playing out, what we now need to see is a successful retest of support at the "neckline" which is currently at $4. What this means in simpler terms, is that the price cannot CLOSE below this, otherwise the pattern is invalidated.
We're also observing a BUY signal in the weekly timeframe; a strong indication that bulls are in control for the near future:

If the pattern holds, the price is likely heading towards the previous local high of $4.7

_______________________________

 PENDLEUSDT
We're also observing very distinctive higher lows and higher highs; a key sign of a bullish market.
The W-Bottom pattern hasn't quite finished playing out, what we now need to see is a successful retest of support at the "neckline" which is currently at $4. What this means in simpler terms, is that the price cannot CLOSE below this, otherwise the pattern is invalidated.
We're also observing a BUY signal in the weekly timeframe; a strong indication that bulls are in control for the near future:
If the pattern holds, the price is likely heading towards the previous local high of $4.7
_______________________________
PENDLEUSDT 
Discord Server
discord.gg/xHJRka3
Cryptocheck Website
thecryptocheck.com
SoftQuant Website
softquant.io
discord.gg/xHJRka3
Cryptocheck Website
thecryptocheck.com
SoftQuant Website
softquant.io
Bài đăng liên quan
Thông báo miễn trừ trách nhiệm
Thông tin và các ấn phẩm này không nhằm mục đích, và không cấu thành, lời khuyên hoặc khuyến nghị về tài chính, đầu tư, giao dịch hay các loại khác do TradingView cung cấp hoặc xác nhận. Đọc thêm tại Điều khoản Sử dụng.
Discord Server
discord.gg/xHJRka3
Cryptocheck Website
thecryptocheck.com
SoftQuant Website
softquant.io
discord.gg/xHJRka3
Cryptocheck Website
thecryptocheck.com
SoftQuant Website
softquant.io
Bài đăng liên quan
Thông báo miễn trừ trách nhiệm
Thông tin và các ấn phẩm này không nhằm mục đích, và không cấu thành, lời khuyên hoặc khuyến nghị về tài chính, đầu tư, giao dịch hay các loại khác do TradingView cung cấp hoặc xác nhận. Đọc thêm tại Điều khoản Sử dụng.